|
|
|
 |
|
|
| Trade History | Trade Strategies | Discussion Forum | Chat Room | Testimonials | Disclaimer |
![]() Key
Pattern Signals and Other Useful Information
Key
Pattern Signals and Other Useful Information
As of May 1st 2007, the educational and trading tip information that's posted on the home page is no longer maintained below as archives because most of the information will now be directly linked to our discussion forum to help search engines increase the ranking of our discussion forum.
If you any questions about the below charts, price action clues involving the pattern signal of our strategies...send email to questions@thestrategylab.com
Disclaimer: The below charts are for educational, informational, entertainment purposes only and they represent trades (real money or simulator) by traders that have access to our strategies.
To read our full disclaimer statement...click here.
With that said, all pattern signals discussed below are applicable for day trading, swing trading and position trading. They exploit trend continuations, trend reversals and range bound price action of Emini Futures (EMD, ER2, ES, NQ, YM), Eurex Futures (DAX, DJ Euro Stoxx50), Euronext Futures (FTSE100, CAC40), NYMEX Oil & Gas Energy Futures (CL, QM, NG), COMEX Gold Metal Futures (GC, ZG), Treasury Financial Futures (ZN, ZF, ZB), CME EuroFX EC, Hang Seng Futures (HSI), Forex Currencies (EurUsd, EurYen, UsdCdn) and Exchange Traded Funds (DIA, IWM, QQQQ, SPY, OIH, XLE, GLD).
Apr 30th Monday 2007
Fee-Based Client Profitable Trade
Click on chart to view actual size
CME Russell 2000 Emini ER2 Futures
We emphasize to our clients the importance of following both the RTH chart and the All Session Globex chart especially when there's a 0830am est key economic report that produces a strong price reaction and pattern signal.
This particular price action was an early trade signal into the big drop you see in the above chart...
A price decline in which volatility showed up especially with all the key market events supporting such an increased in volatility.
The trade in Emini ER2 resulted in a WRB pt1 - pt5 level exit depending upon what your goal was for the trade and interval use after WRB pt1.
Price Action Pattern Signal Source: Swing Trading Report (STR)

Apr 27th Friday 2007
Fee-Based Client Profitable Trade
Click on chart to view actual size
CME S&P 500 Emini ES Futures
This trade exploited an s/r zone that developed in the first 30mins of trading and visually had some key prior WRB's to use as profit targets.
Also, the theme all week has been these price declines in the early trading session that sets up a nice counter-thrust back to the upside for new intraday highs.
The trade in Emini ES resulted in a WRB pt1 - pt5 level exit depending upon what your goal was for the trade and interval use after WRB pt1.
Price Action Pattern Signal Source: Swing Trading Report (STR)

Apr 24th Tuesday 2007
Fee-Based Client Profitable Trade
Click on chart to view actual size
CME Nasdaq 100 Emini NQ Futures
This trade represents a sister trade via the pattern signal occurring in QQQQ.
This trade shows exactly how declining volatility or declining volume doesn't indicate prices will decline for those traders that get confused by volume analysis on trend days.
In fact, volatility provides more clues than volume making it an adequate substitute of volume considering the nuances involving volume analysis.
The trade in Emini NQ resulted in a WRB pt1 - pt20 exit depending upon what your goal was for the trade and interval use after WRB pt1.
Price Action Pattern Signal Source: Advance Price Action Only Report (APAOR)

Apr 23rd Monday 2007
Fee-Based Client Profitable Trade
Click on chart to view actual size
Euronext FTSE-100 Futures
The Dark WRB penetrated into the s/r zone of the White Hammer line to signal that the FTSE-100 will attempt a GAP fill.
It then went sideways for about eight intervals until it dropped below another s/r zone.
The trade resulted in a WRB pt1 - pt5 exit depending upon what your goal was for the trade.
Price Action Pattern Signal Source: Swing Trading Report (STR)

Apr 19th Thursday 2007
Fee-Based Client Profitable Trade
Click on chart to view actual size
NYMEX Light Crude Oil CL
This short signal via WRB Analysis was the result of a shift in supply/demand via a prior s/r zone that developed between 6:05am - 6:20am.
Depending upon a clients goals for the trade, this trade resulted in a WRB pt1 - pt7 exit with the WRB pt7 occurring as an almost valid bullish signal at 11am via a pattern signal from our AJCTR trading report.
Price Action Pattern Signal Source: Swing Trading Report (STR)

Apr 18th Wednesday 2007
Fee-Based Client Profitable Trade
Click on chart to view actual size
Russell 2000 Emini Futures ER2
This short signal via WRB Analysis was the result of a shift in supply/demand via a prior s/r zone that developed between 10:40am - 11:05pm est.
Depending upon a clients goals for the trade, this trade resulted in a WRB pt1 - pt3 exit with the WRB pt3 occurring in the s/r zone of a prior long shadow hammer line.
Price Action Pattern Signal Source: Swing Trading Report (STR)

Apr 17th Tuesday 2007
Japanese Candlestick Pattern
Click on chart to view actual size
Oil Service HOLDRs OIH
This particular sub-group signal of a Bearish Engulfing produce a trade for some of our clients that generated a WRB pt 1 - pt8 exit levels.
However, the s/r zone occurred via intermarket analysis (not shown on the above chart) and allowed clients to ride the trade downwards along with producing an opportunity to ADD to the profitable position via the same pattern signal appearing soon after 1:15pm est.
To read a basic understanding of Bearish Engulfing patterns...click here.
To ask questions and get answers about the Bearish Engulfing pattern so that you'll be a little more prepared to recognize it as it is appearing in realtime...click here.

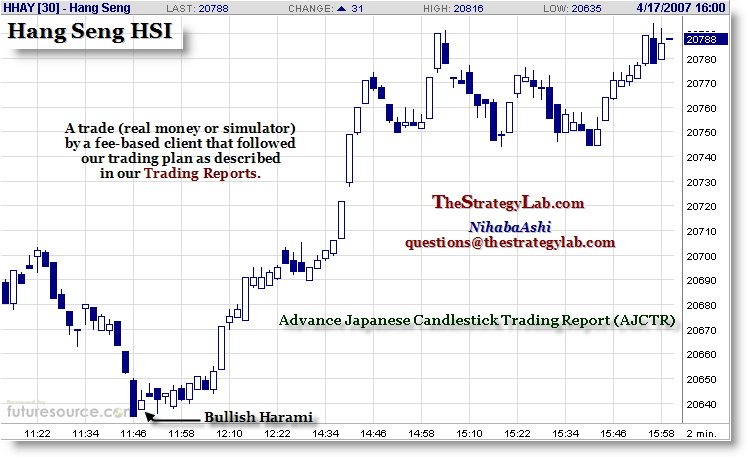
Apr 17th Tuesday 2007
Japanese Candlestick Pattern
Click on chart to view actual size
Hang Seng Index Futures HSI
This particular sub-group signal of a Bullish Harami produce a trade for some of our clients that generated a WRB pt 1 - pt7 exit levels.
However, the prior s/r zone occurred early in the trading day (not shown on the above chart) and allowed clients to ride the trade upwards especially with all the support from the bullish price action of other Asian markets.
To read a basic understanding of Bullish Harami patterns...click here.
To ask questions and get answers about the Bullish Engulfing pattern so that you'll be a little more prepared to recognize it as it is appearing in realtime...click here.
Apr 16th Monday 2007
Japanese Candlestick Pattern
Click on chart to view actual size
Euronext Futures CAC-40
This particular sub-group signal of a Bullish Engulfing produce a trade for some of our clients that generated a WRB pt 1 - pt5 exit levels.
However, the prior s/r zone occurred early in the trading day (not shown on the above chart) and allowed clients to ride the trade upwards especially with all the support from other European futures.
To read a basic understanding of Bullish Engulfing patterns...click here.
To ask questions and get answers about the Bullish Engulfing pattern so that you'll be a little more prepared to recognize it as it is appearing in realtime...click here.

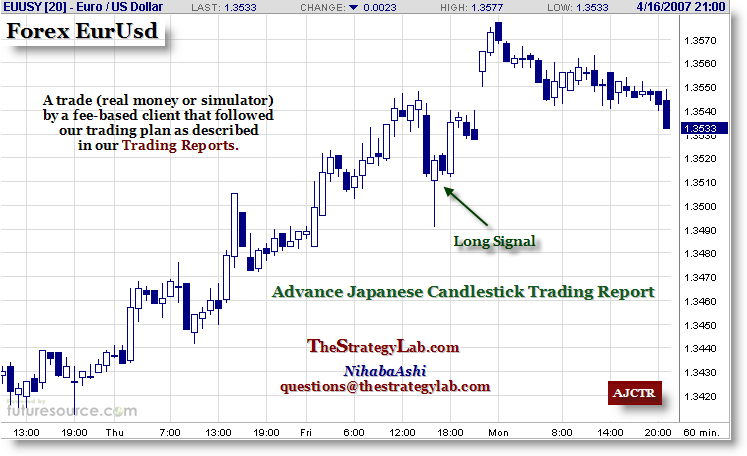
Apr 13th Friday 2007
Profitable Free Strategy
Click on chart to view actual size
Forex Currency EurUsd
This bullish signal occur as a trend continuation signal and helped EurUsd reached at least a WRB profit target 1 level.
Some of our clients prefer this particular price action because the lows of the pattern signal tested a prior s/r zone.
Also, we have several profitable pattern signals and to freely learn and apply one of our pattern signals from the below the Advance Japanese Candlestick Trading Report...click here.
Price Action Pattern Signal Source: Advance Japanese Candlestick Trading Report (AJCTR)
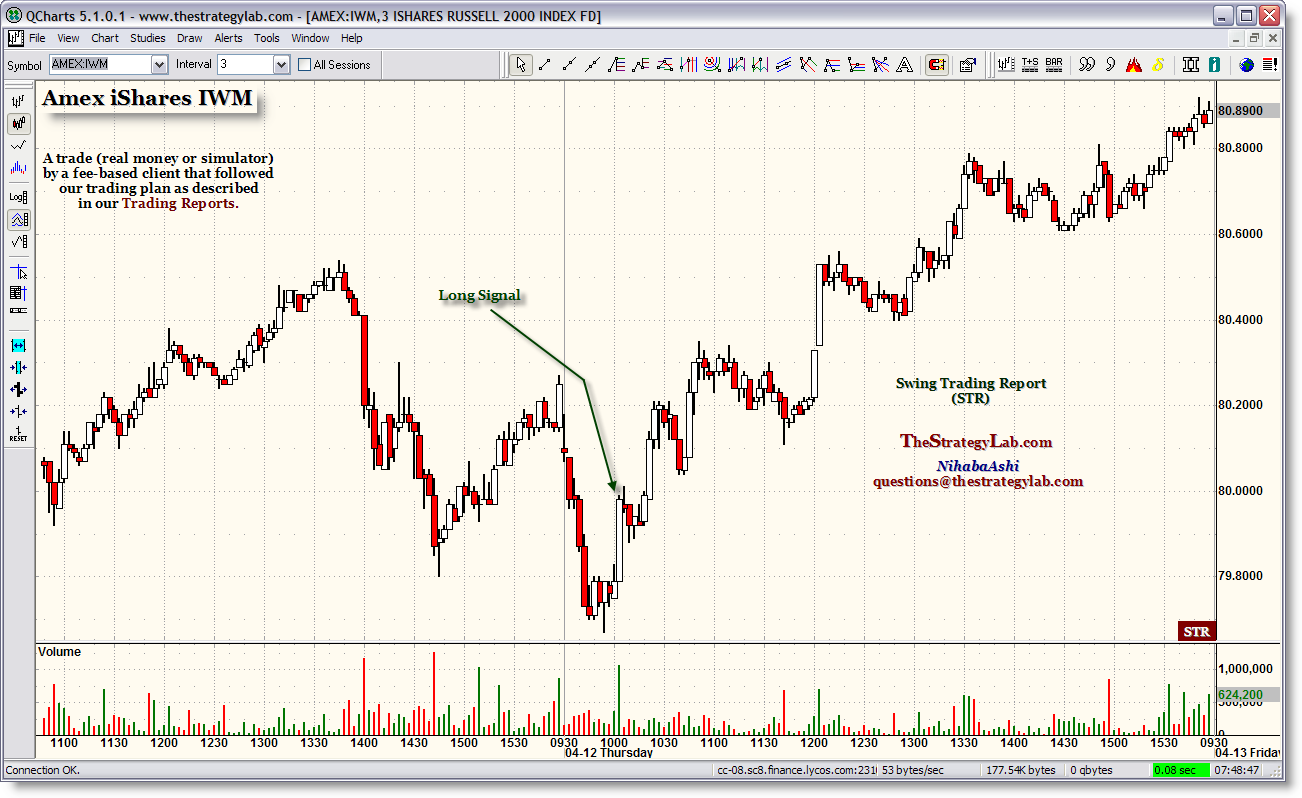
Apr 12th Thursday 2007
Fee-Based Client Profitable Trade
Click on chart to view actual size
Exchange Traded Fund iShares IWM
The contracting volatility prior to the White WRB long signal helped many of our clients prepare for this trade.
It's a pattern signal that exploits the changes in volatility and supply/demand along with managing the entry within a s/r zone that was supporting the pattern signal.
Depending upon a clients goals for the trade, this trade resulted in a WRB pt1 - pt6 exit.
Price Action Pattern Signal Source: Swing Trading Report (STR)
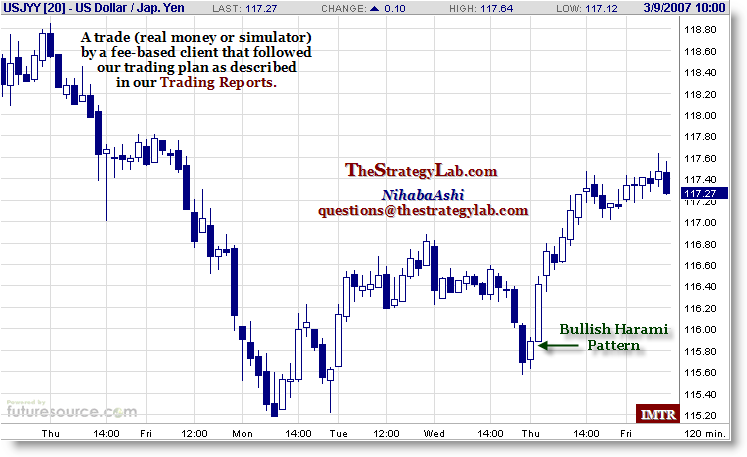
Mar 8th Thurs 2007
Japanese Candlestick Pattern
The Bullish Harami pattern helped spark a rally in Forex Currency UsdYen that would have provided any trader with WRB pt3 - WRB pt4 level profits depending upon how they managed the volatility in wake of the big downtrend that occurred in the prior trading week.
To view the actual chart of Forex UsdYen...click here.
To read a basic understanding of Bullish Harami patterns...click here.
To ask questions and get answers about the Bullish Harami pattern so that you'll be a little more prepared to recognize it as it is appearing in realtime...click here.
Mar 6th Tues 2007
Fee-Based Client Profitable Trade
AMEX Oil Service HOLDRs OIH price action of this pattern signal is dependent upon volatility analysis, support/resistance zones, intermarket analysis and a key price action that's only discussed with fee-based clients.
With that said, this particular client like the trade in that the white line (the confirmation interval)...continue reading.
These strategies are applicable for day trading, swing trading and position trading. If you're looking for profitable strategies that have an edge in exploiting trend continuations, trend reversals and range bound markets...click here.
Feb 27th Tues 2007
Fee-Based Client Profitable Trade
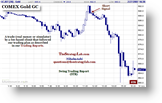
The stock market took a beating today and when such occurs there usually is a flight to quality to COMEX Gold GC or any other Gold trading instrument.
However, today there was too much bearish geopolitical news, bearish Asia markets to allow such a hedge.
In fact, the flight of quality was into...continue reading.
Feb 20th Tues 2007
Fee-Based Client Profitable Trade
This pattern signal that a client took was actually a contingency plan signal from the trading report after a failed prior Long signal.
Therefore, this is an excellent example of why trade management after entry is so critical to the success of a profitable trader because too many newbie traders spend far too much time on...continue reading.
Feb 16th Fri 2007
Profitable Free Strategy
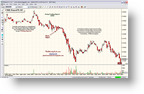
If you missed this pattern signal on Feb 16th Friday in the CME Russell 2000 Emini ER2 futures...don't worry because there will be another pattern signal that will occur within the price range of this pattern signal.
However, most likely it will be a reliable pattern signal from our Swing Trading Report (STR).
In addition, you should notice that volume and volatility was declining as the price continue to rise. That particular type of price action is what gets...continue reading.
Feb 13th Tues 2007
Fee-Based Client Profitable Trade
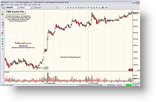
The pattern signal in the CME Nasdaq 100 Emini NQ futures was a reaction in the price action that had occurred in the prior two trading days.
Take a look at your charts for NQ on Feb 9th Fri and you'll see a trend day (expansion day) downwards. Next, on Feb 12th Fri...continue reading.
These strategies are applicable for day trading, swing trading and position trading. If you're looking for profitable strategies that have an edge in exploiting trend continuations, trend reversals and range bound markets...click here.
Feb 9th Fri 2007
Fee-Based Client Profitable Trade
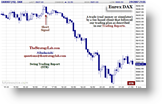
Trading gaps has big rewards if you approach it via a rule based methodology instead of trying to use intuition (gut feel) especially when it involves trading instruments with good volatility like the Eurex DAX futures.
However, many newbie traders in error think that gap trading...continue reading.
These strategies are applicable for day trading, swing trading and position trading. If you're looking for profitable strategies that have an edge in exploiting trend continuations, trend reversals and range bound markets...click here.
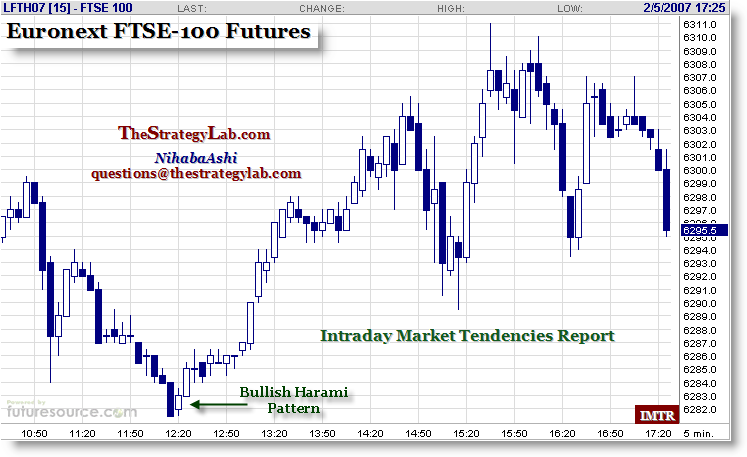
Feb 6th Tues 2007
Japanese Candlestick Pattern
To view the actual chart of FTSE-100...click here.
To read a basic understanding of Bullish Harami patterns...click here.
To ask questions and get answers about the Bullish Harami pattern so that you'll be a little more prepared to recognize it as it is appearing in realtime...click here.
Feb 5th Mon 2007
Back testing Credibility?
First of all, back testing is needed to confirm if you have a positive expectancy in your strategy. Therefore, if back testing shows you that your method will lose money, it would be a poor decision to trade that method with real money even if it was via a small size because the psychological aspects of losing money could have a negative impact on your ability to be properly prepared to trade in the future.
Further, if your back testing results are...continue reading.
Feb 1st Thurs 2007
Fee-Based Client Profitable Trade
The CME Russell 2000 Emini ER2 futures has been giving excellent trade signals via our WRB Analysis for those clients wanting to exploit the swing points of a...continue reading.
These strategies are applicable for day trading, swing trading and position trading. If you're looking for profitable strategies that have an edge in exploiting trend continuations, trend reversals and range bound markets...click here.
Jan 30th Tues 2007
Movie for Traders
This is actually a TV series that's now available on DVD about traders and it's the best one I've ever seen...earning a
rating from me.
The TV series is in the setting of the Toronto-based investment house, Gardner/Ross, Traders explores the intimate lives and loves, the mystique and monetary machinations of investment bankers whose high-stakes decisions...continue reading.
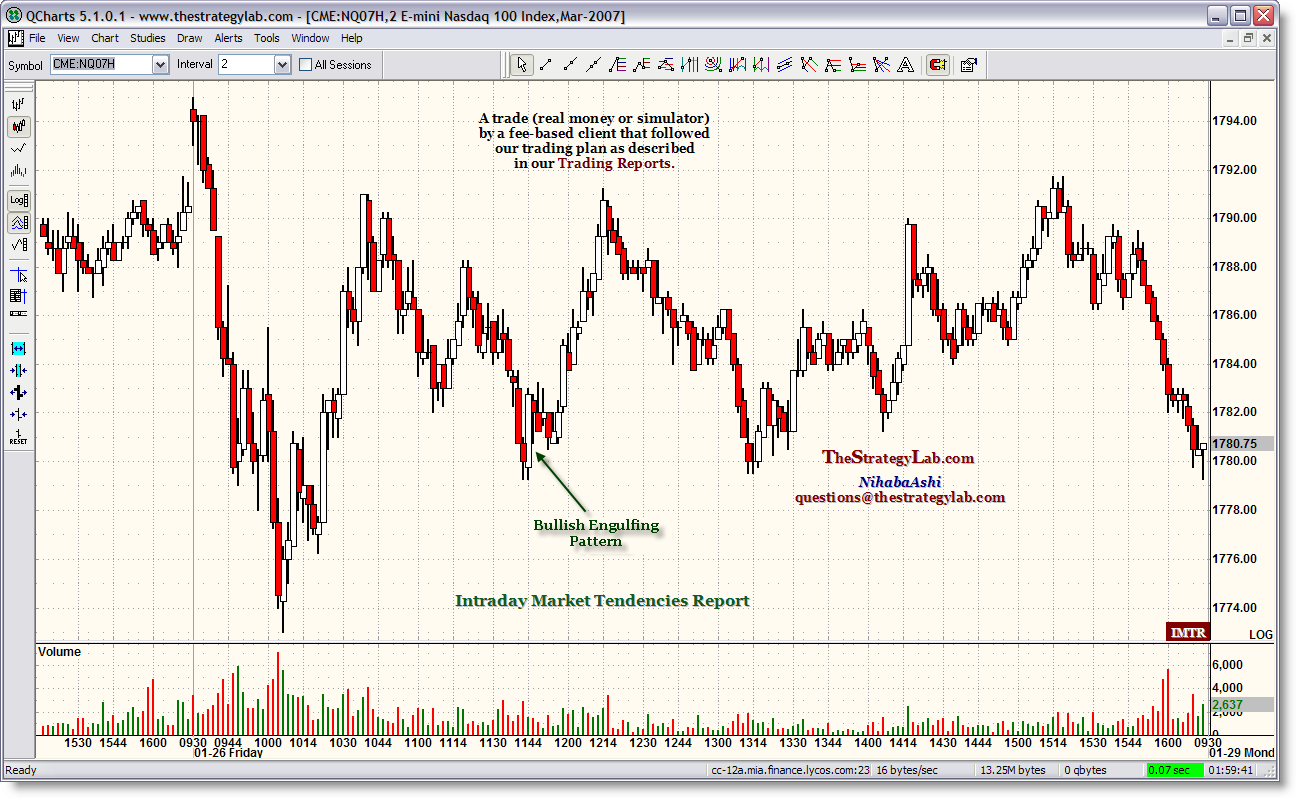
Jan 26th Fri 2007
Japanese Candlestick Pattern
The Bullish Engulfing pattern almost stalled and took about 16mins to reach a WRB pt1 level. Next, about 14mins after the WRB pt1 level, it reach a WRB pt2 level profits for those traders of the CME Nasdaq 100 Emini (NQ) futures.
To view the actual chart of NQ...click here.
To read a basic understanding of Bullish Engulfing patterns...click here.
To ask questions and get answers about the Bullish Harami pattern so that you'll be a little more prepared to recognize it as it is appearing in realtime...click here.
Jan 23rd Tues 2007
Profitable Free Strategy
The Dark WRB that occurred four intervals earlier, helped setup the bullish pattern signal as it easily reached a WRB pt3 level as it moved into the 10am est....continue reading.
Jan 17th Weds 2007
Book for Traders
I gave the book Stock Trader's Almanac a
In addition, to know what other books has help our trading and sparked research into many different aspects of price action resulting in developing our own market edges...click here.
Jan 15th Mon 2007
Fee-Based Client Profitable Trade
The Hang Seng HSI futures has been a good market to trade for some of our clients the past few years and the price drop the past week or so setup nicely this bullish pattern signal...continue reading.
These strategies are applicable for day trading, swing trading and position trading. If you're looking for profitable strategies that have an edge in exploiting trend continuations, trend reversals and range bound markets...click here.
Jan 13th Sat 2007
Screen Capture Video Programs
I recently answered a question at another discussion forum in which a trader wanted to record times and sales, NY open book, broker execution platform and his reactions (mouse movements and audio) as he progress from one trade to the next trade...continue reading.
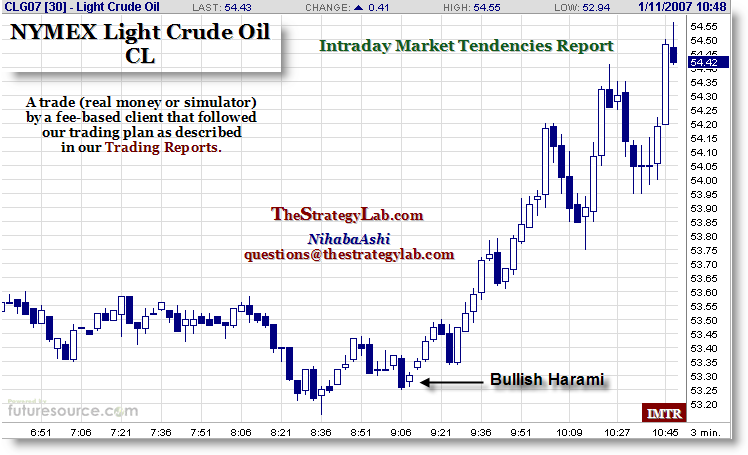
Jan 11th Thurs 2007
Japanese Candlestick Pattern
To view the actual chart of CL...click here.
To read a basic understanding of Bullish Harami patterns...click here.
To ask questions and get answers about the Bullish Harami pattern so that you'll be a little more prepared to recognize it as it is appearing in realtime...click here.
Jan 10th Weds 2007
Fee-Based Client Profitable Trade
Some of our clients exploited this pattern signal in the Exchange Traded Fund SPDRs (SPY) while others took trades in the CME S&P 500 Emini Futures (ES).
However, this particular client...continue reading.
These strategies are applicable for day trading, swing trading and position trading. If you're looking for profitable strategies that have an edge in exploiting trend continuations, trend reversals and range bound markets...click here.
Jan 8th Mon 2007
Book for Traders
I gave this book a
In addition, to know what other books has help our trading and sparked research into many different aspects of price action resulting in developing our own market edges...click here.
Jan 4th Thurs 2007
Profitable Free Strategy
The first bullish pattern signal appeared around 2:55pm est when Oil bounced off its lows of the intraday as....continue reading.
Jan 3rd Weds 2007
Fee-Based Client Profitable Trade
Take a look at the XAU.X Phlx Gold & Silver Sector Index. There was a support/resistance zone established on December 28th that proved to be to tough for Gold to break through...continue reading.
These strategies are applicable for day trading, swing trading and position trading. If you're looking for profitable strategies that have an edge in exploiting trend continuations, trend reversals and range bound markets...click here.
January - December 2006
Key Market Archives
Take a look at the key markets archives for 2006...click here.
DAX FTSE-100 CAC-40 EC ER2 ES NQ YM QQQQ SPY IWM DIA CL QM NG OIH XLE GC GLD ZN ZB ZF BUND EurUsd UsdCdn
| Home | Trade Strategies | Trading Manual | Testimonials | Traders Library | Refund Policy |
| Performance Record | Trade History | Japanese Candlesticks | Discussion Forum | #FuturesTrades Chat Room |
| About Us | Referral Program | Feedback | Privacy | Disclaimer | Contact |
![]()
Copyright © 2002 - 2007. The Strategy Lab. All rights reserved.