Quote:
I usually look for WRB's where the body is greater than at least the previous 7 rather than just the previous 3 as this reduces the number of WRB's I have to analyse and could maybe highlight just the more important ones, but please let me know if you think this is flawed logic.
This is not a flawed logic and you can use any number at 3 or above but just don't use a WRB number below 3. Yet, just be aware that when you reduce the number of WRB's to analyze you will also reduce the number of trade opportunities because you won't have as many WRB S/R Zones to confirm whatever trade signals you're using.
Quote:
I would like to know which WRB's are classed as key change in supply/demand areas as I have read that all WRB's cannot be treated the same.
Correct...all WRB's are not treated the same nor is all important. I'll give you access to the WRB Analysis Tutorial chapters 1, 2 and 3 so that you can begin to understand why all WRB's are not the same. It's critical that you ask questions during the 30 day free trial if something doesn't make sense or ask questions to verified what you've learned.
Quote:
Just from eye-balling WRB's on my charts I have found that when they breach previous highs or lows of a range WRB's can be particularly usefull when price re-enters them so I have mainly been focusing on these for now.
I think I understand what you're explaining and your trade signal must obviously be occurring within price action as you've just described.
Quote:
I also have a question about how multiple timeframes can be used with WRB analysis. I like to look at the hourly charts for what I think are areas where the supply/demand dynamic changes and then drill down to something like a M15 chart to find entries. This gets slightly confusing because I also look at the 4 hour charts to choose direction and often get conflicting signalls between timeframes. Do you feel it is best to try and ID WRB's on higher timeframes and look for entries on the lower timeframes or try to do everything on a single timeframe to avoid confusion?
Looks like this is a question amongst the most recent WRB Analysis Tutorial trial users. Thus, I'll update the WRB Analysis Tutorials with a few paragraphs about WRB Analysis for those that use multiple timeframes to determine their trade signals.
With that said, because your trade method involves the 4 hour, 1 hour and 15 min chart intervals...you should then only use WRB S/R Zones that occur within (overlap) in all three of those time frames. However, if the overlapping involves a zone that you had a short signal and another zone (different time frame) that you had a long signal...best to ignore that type of trade or dramatically reduce your position size if you feel the need to trade when there's conflict in the price action.
Quote:
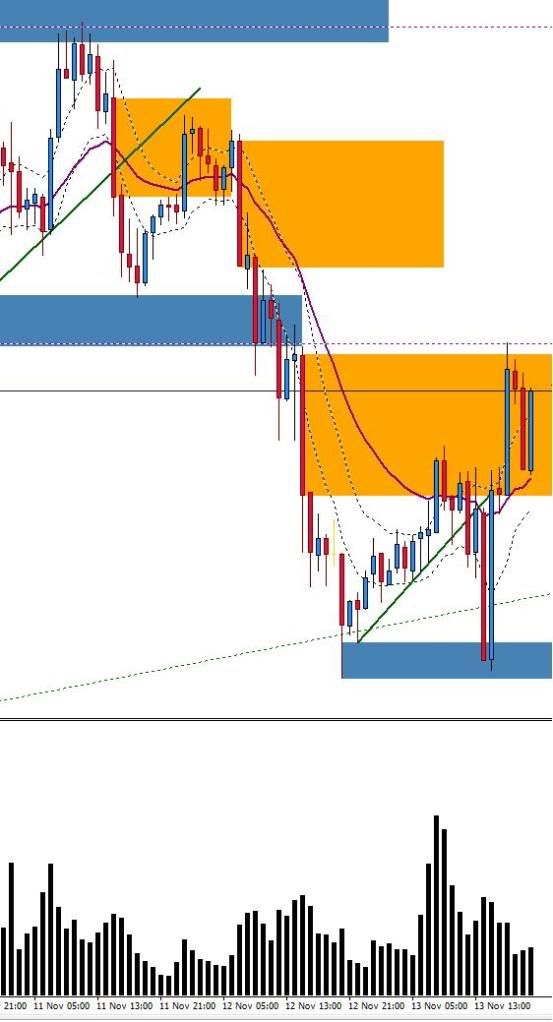
The main issue I have is trying to ID the WRB's which are significant and those which can be over looked. I have attatched a chart from the end of last week with WRB's (orange) and S/R areas (blue) I was using to look for entries in and around. I was looking for shorts due to weakness on the 4 hour & daily timeframes. I would be gratefull if you could comment on the WRB's I have chosen on the chart along with anything else you feel is relevant.
My attached chart shows that I like what you call important WRBs (key changes in supply/demand) and your s/r areas. However, I made a comment on the chart that the blue zone and the WRB are no longer important due to the fact they ran into price action that filled them in sort'uv speak. However, tutorial chapter 2 will teach you more about open/close WRB S/R zones.
I've now included you on the access list for the 30 day free trial and the link below is now valid for you to access the WRB Analysis Tutorial Chapters 1, 2 and 3 that represent the basic tutorial chapters. You'll have access for 30 days in which I will provide support to your questions while you merge WRB Analysis into whatever trade signal strategy you're using to help improve the performance of your trade strategies. Therefore, you must now only post your WRB Analysis questions at the below link that's
reserve for those taking the 30 day free trial.
http://www.thestrategylab.com/tsl/forum/viewforum.php?f=61In contrast, the advance tutorial chapters are 4 - 12 are price at $75 per chapter and you qualify for the special discount offers at the below link.
http://www.thestrategylab.com/tsl/forum/viewtopic.php?f=5&t=165Best Regards,
M.A. Perry
Trader and Founder of
WRB Analysis (wide range body analysis)

@
http://twitter.com/wrbtrader http://www.thestrategylab.com Phone: +1 708 572-4885
Business Hours: 8am - 5pm est (Mon - Fri)
Skype Messenger: kebec2002
questions@thestrategylab.com