
Quote:
Hi Niha, lets use our definition
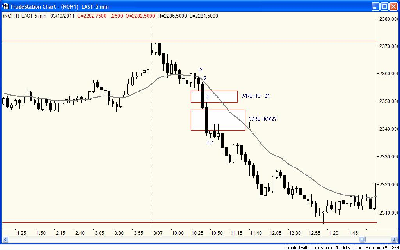
- "i3" the 1st interval before the WRB Hidden GAP
- "i2" the WRB Hidden GAP interval
- "i1" the 1st interval after the WRB Hidden GAP
- "i0" the 2nd interval after the WRB Hidden GAP
I labaled them on chart im sending you below.
"i2" forms and we get WRB, so im on lookout for possible WRB HG if
we get "i1" that CLOSES and forms WRB HG. It did I labaled the area as WRB HG. I see that the "i1" interval that formed the WRB HG is SAME SIZE as our "i2" interval. Then we get the small bull candle i labaled "io" What do u do when "i1" interval is so big and we have 2 WRB HG's.

Can you explain the "Psychology" behind these big bars forming this WRB HG's? and is my labeling correctly?
Chart
Attachment:
 031211-Private-Message-Emini-NQ-Futures-Chart.png [ 238.66 KiB | Viewed 428 times ]
Attachment:
 031211-Private-Message-Question.png [ 62.85 KiB | Viewed 406 times ]
http://oi55.tinypic.com/sqinbp.jpg The above question was received via private message @ http://www.elitetrader.com Hi,
Thanks for the chart to correlate with your price action description.
i2 is a WRB HG but if i1 is bigger than i2...then i1 is also a WRB HG. Simply, it's not uncommon is a strong directional price action to have consecutive WRB Hidden GAPs. Therefore, in your chart example, there's
"runaway supply"...supply increasing with increasing volatility. You may see such as a
reaction to breaking news, economic reports, key FED or ECB speech et cetera as described in the WRB Analysis Tutorial Chapter 2. Also, this price action can occur as a swing point or strong continuation price action. In your chart...it's a strong continuation price action (not a swing point) and the swing point is around 0930am est on the all session chart of Emini NQ (not the regular session chart you show).
I have all session and regular session chart side by side when I trade.With that said, on your chart of
Monday March 7th, i1 WRB HG is bigger than i2 WRB HG...not the same size. Thus, when i1 completed, at that moment in time it was actually i0. However, when the i0 with question mark on your chart had completed, it transformed the WRB HG #2 into i1.
Not sure about what you meant 'what to do".If you Shorted at the swing point around 0930am est...WRB Hidden GAPs that form below/after the price of your Short position...that's a
profit target. Just as important, any one of those back to back (consecutive) WRB Hidden GAPs can be used as a WRB Zone if qualified as such via any of the tutorial chapters 2 - 12.
In fact, the WRB HG #2 on your chart did qualify as a WRB Zone via one of the advance tutorial chapters 4 - 12. Further, you should take a look at your
Tuesday March 8th price action of Emini NQ futures. You'll see that the price action of Emini NQ returned to that WRB Zone. Thus, had you gotten a Long signal early Tuesday morning...you could have held that position until it returned to that WRB Zone price area of WRB HG #2.
Also, if you're wondering if there was a Short signal on Monday March 7th inside the price action of WRB HG #1 or #2...I don't see one your 5min chart but I myself Shorted the Russell 2000 Emini TF futures around that time that resulted in my best trade of the year so far. However, that trade was via the price action on the 1min and 2min chart as an intuition trade due to a late entry in reaction to a recent prior Short position that resulted as a loss but a valid trade signal on the 1min or 2min chart.
I watch different chart intervals of the Emini TF futures to ensure I don't miss a trade opportunity that's occurring on one of those intervals instead of only watching one specific interval.
Regards,
M.A. Perry
---------------------
Best Regards,
M.A. Perry
Trader and Founder of
WRB Analysis (wide range body/bar analysis)
Price Action Only Trading (no indicators)

@
http://twitter.com/wrbtrader and http://stocktwits.com/wrbtrader Phone: +1.708.572.4885
Business Hours: 8am - 5pm est (Mon - Fri)
Skype Messenger: kebec2002
questions@thestrategylab.comGo Back To TheStrategyLab.com Homepage
