Attachment:
 Email_Question_022010_rinku.sharma84.png [ 112.39 KiB | Viewed 412 times ]
Hi rinku.sharma84,
Thanks for the email questions about Gold GC, Copper HG and Oil CL futures. Please click on the attached chart below to see the full size. You'll see highlighted green and orange areas. Those price areas represents key changes in supply/demand to be used to look for trade signals and/or profit targets.
Simply, post a message here at the forum when prices in Gold, Copper or Oil reaches any of those highlighted key price areas on the chart and I'll take another look at the price action. If trade signals appears within those key price areas...it'll be via the
Volatility Trading Report (VTR). However, Gold GC on the daily chart is currently within a key price area (orange highlight) but currently I see no trade signals and that's because it's contracting.
Also, if you want free access with 30 day support to the WRB Analysis Tuturials...please follow the instructions @
http://www.thestrategylab.com/tsl/forum/viewtopic.php?f=5&t=180 Thus, it's extremely important that we first identify the key price areas via the WRB Analysis Tutorials prior to looking for trade signals via the Volatility Trading Report (VTR). The charts below show the key zones and we must now wait for the price action to reach those levels.
Attachment:
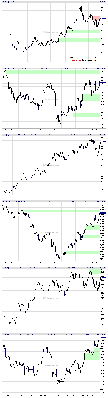 021910_Gold_GC_Copper_HG_Oil_CL_Futures_WRB_Zones.png [ 104.14 KiB | Viewed 493 times ]
Best Regards,
M.A. Perry
Trader and Founder of
WRB Analysis (wide range body analysis)
 @ http://twitter.com/wrbtraderhttp://www.thestrategylab.com
 Phone: +1 708 572-4885
Business Hours: 8am - 5pm est (Mon - Fri)
Skype Messenger: kebec2002
questions@thestrategylab.com
