 Trade Results of M.A. Perry
 Trader and Founder of
WRB Analysis (wide range body/bar analysis)
Price Action Trading (no technical indicators)
Attachment:
 112511-wrbtrader-PnL-Blotter-Profit-1570.png [ 73.97 KiB | Viewed 296 times ]
click on the above image to view today's performance verification Trade Performance for Today: +15.70 points or
$1570 dollars in the Russell 2000 Emini TF ($TF_F) Futures.
Russell 2000 Emini TF Futures - 1 tick or 0.10 = $10.00 dollars and there's more contract information @
The ICE.
S&P 500 Emini ES Futures - 1 tick or 0.25 = $12.50 dollars and there's more contract information @
CMEGroup.
In addition, all trades were posted real-time in the
free #FuturesTrades chat room. Today's
#FuturesTrades trading chat room logs provides details (e.g. time, price, contract size) about each one of my trades from entry to exit along with price action commentary as the trade traversed...all archived
@ http://www.thestrategylab.com/ftchat/forum/viewtopic.php?f=96&t=1066.
To join our
free chat room...
registration instructions located at a different forum
@ http://www.thestrategylab.com/ftchat/forum/viewtopic.php?f=5&t=630Also, posted below are direct links to information about my
trade methodology and
trading plan (there's a difference between the two) that enables me to identify key trading areas in the price action that represent changes in supply/demand and volatility along with being able to exploit these changes via WRB Analysis (wide range body/bar analysis).
 WRB Analysis Tutorials
 @
http://www.thestrategylab.com/WRBAnalysisTutorials.htm and there's a
free study guide of the WRB Analysis Tutorial Chapters 1, 2 and 3 @
http://www.thestrategylab.com/tsl/forum/viewtopic.php?f=119&t=718.
Volatility Trading Report (VTR) @
http://www.thestrategylab.com/VolatilityTrading.htm and there's a
free trade signal strategy @
http://www.thestrategylab.com/tsl/forum/viewforum.php?f=89 so that you can freely test drive one of our trade strategies with support
prior to purchasing the Volatility Trading Report (VTR).
Trading Plan Daily Routine @
http://www.thestrategylab.com/tsl/forum/viewtopic.php?f=145&t=1269 -----------------------------
Market Summaries The below summaries by
Bloomberg,
CNNMoney and
Yahoo! Finance helps me to do a quick review of the fundamentals, FED/ECB/IMF actions or any important global economic events that had an impact on today's price action. Simply, I'm a strong believer that many variables (key market events) causes key changes in supply/demand and volatility that results in swing points and strong continuation price actions. Thus, I pay attention to these key market events from one trade to the next trade to give me the
market context for my
technical analysis. Just as important, these summaries becomes my
archives to allow me to understand what was happening on any given trading day in the past...something I can not get from my broker statements alone.
Another Awful Week For Stocks. Thanks, Europe! Attachment:
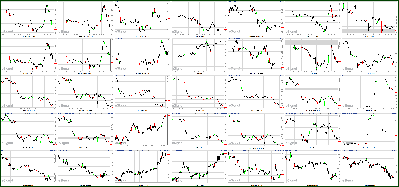 112511-Key-Price-Action-Markets.png [ 526.46 KiB | Viewed 305 times ]
click on the above image to view today's price action of key markets NEW YORK (CNNMoney) -- U.S. stocks ended lower Friday, logging the worst weekly losses in two months, as eurozone fears continued to weigh on investor sentiment.
The Dow Jones industrial average (INDU) lost 26 points, or 0.2%, finishing in the red for a fourth consecutive day. The S&P 500 (SPX) fell 3 points, or 0.3% and the Nasdaq composite (COMP) dropped 19 points, or 0.8%, booking their eighth consecutive daily declines.
Worries about Europe's debt crisis continued to dominate the week amid a series of lackluster debt auctions and rising eurozone bond yields. Stocks around fell sharply as investors grew anxious, with the Dow dropping 4.8%, the S&P 500 losing 4.7% and the Nasdaq tumbling more than 5% this week. Those were the worst weekly declines since mid-September.
Mounting yields continued to trouble investors on Friday. Italian 10-year bond yields moved back above 7%, a level that eventually required bailouts for Greece, Portugal and Ireland. The Spanish 10-year yield also rose to within spitting distance of the worrisome level.
* Italian bond yields back in the danger zone"We could fall into a vicious cycle where borrowing costs rise, triggering downgrades which then cause yields to increase further," said Kathy Lien, director of currency research at Global Forex Trading.
A day earlier, Fitch downgraded Portugal's sovereign debt rating to junk, while Moody's axed Hungary's credit rating further into junk territory. And on Friday, Standard and Poor's
downgraded Belgium's credit rating.
"European officials need to act and act quickly if they want to prevent Spanish yields from rising to Italian levels and to save Italy from paying more than 8% to borrow," said Lien, in a research note.
On Thursday, German Chancellor Angela Merkel and French President Nicolas Sarkozy continued to oppose eurobonds as a solution, but the leaders did suggest that some type of fiscal unity could help stem the crisis.
* Europe's debt: Pressure's onBut any move would require a treaty change that all 27 European Union members would need to ratify, a process that could take years. That's among the options expected to be discussed when EU leaders gather in Brussels next month.
U.S. markets, which were closed Thursday for Thanksgiving, closed at 1 p.m. Friday, and trading volumes remained thin during the shortened session.
U.S. stocks ended Wednesday down more than 2%, as eurozone fears rumbled on and a preliminary report showed that Chinese manufacturing has slowed sharply.
* Video - Should Europe pool its debt?Companies: Shares of AT&T (T, Fortune 500) eased after the telecom service provider said Thursday it was taking a $4 billion charge to cover the break-up fee it will owe, if its deal to acquire T-Mobile falls through. The FCC said earlier this week that it will oppose the merger, becoming the second regulatory body to do so.
As shoppers hit the malls and big box stores to take advantage of Black Friday deals, retail stocks were in focus. Shares of Best Buy (BBY, Fortune 500) slipped slightly, while Amazon.com (AMZN, Fortune 500) shares dropped 3.5%.
* Video - Best Buy's Black Friday gameplanWorld markets: European stocks closed higher. Britain's FTSE 100 (UKX) rose 0.6%, the DAX (DAX) in Germany gained 1.2% and France's CAC 40 (CAC40) added 1.3%.
Asian markets ended the day lower. The Shanghai Composite (SHCOMP) lost 0.7%, the Hang Seng (HSI) in Hong Kong dropped 1.4%, and Japan's Nikkei (N225) fell 0.1%.
Currencies and commodities: The dollar gained strength against the euro, the British pound and the Japanese yen.
Oil for January delivery rose 40 cents to $96.57 a barrel.
Gold futures for December delivery fell $10.10 to $1,685.70 an ounce.
Bonds: The price on the benchmark 10-year U.S. Treasury fell slightly, with the yield rising to at 1.97% from 1.94% late Wednesday.
 Market Update
 1:10 pm : The major market averages ended lower as the Nasdaq paced the decline with a loss of 0.8%. Today marked the seventh consecutive close in the red for the S&P 500, during which the index has fallen 7.8%. Today's slide caps off the worst Thanksgiving week ever for stocks as the S&P 500 tumbled 4.7%.
Financials were the top performers today as the S&P 500 Financial Index gained 0.4% collectively. Citigroup (C $23.63, +$0.12) and Bank of America (BAC $5.17, +$0.03), two of the more heavily beaten down names in the space, saw solid gains.
Shares of AT&T (T $27.41, -$0.14) fell 0.5% after the company announced it was withdrawing its T-Mobile merger plan from further consideration by the Federal Communications Commission. The company announced it will first focus on receiving approval from the U.S. Justice Department which filed a lawsuit to block the merger. AT&T is setting aside $4 billion which it would need to pay T-Mobile's parent company Deutsche Telekom should the deal collapse.
Retailers underperformed despite today's excitement over Black Friday, the busiest shopping day of the year. The SPDR S&P Retail Index (XRT $48.50, -$0.48) lost 1.0% after running to a gain of 0.7% early in the session. Online retailer Amazon (AMZN $182.40, -$6.59) was one of the worst performers in the space, ending down 3.5%. Home improvement stores Home Depot (HD $36.47, -$0.05) and Lowe's (LOW $22.68, +$0.20) outperformed while electronics retailer Best Buy (BBY $25.63, -$0.08) slid into the red.
Commodities were mixed as precious metals sold off while energy traded flat to higher. After a brief run into positive territory gold ended the day down more than $10 near $1685. Silver, the more speculative of the precious metals, fell more than 2.5% to finish the day just above the $31 level. Crude oil ran to session highs near $97.50 before paring its gains and ending near $96 per barrel. Natural gas outperformed all session long, gaining 1.5% to $3.51.
Markets were closed on Thursday in observance of Thanksgiving.
Widespread weakness on Wednesday resulted in a broad-based sell-off that sent stocks to their lowest level in more than a month. The descent came as market participants, already feeling bearish, reacted to the Fed's decision to increase capital controls for banks. Participants remained pessimistic following underwhelming data from abroad and an in-line initial jobless claims report, mixed durable goods orders data, and a mixed reading on personal income and spending.
On Tuesday stocks overcame disappointment related to downward revision to third quarter GDP, but a loss of momentum left the major averages to roll over. Stocks managed to rebound because of a combination of technical support and a headline that the IMF has established a new liquidity line, but the effort still failed to give stocks a positive finish.
Market participants were put into a negative mindset at the start of the week by renewed concerns about financial conditions in Europe's periphery and core after Moody's issued cautious comments about France's debt rating outlook. Bias was also imbued by the inability of U.S. officials to look past partisan politics in an effort to address domestic fiscal conditions. Such discouraging themes came as many participants continued to reflect on a significant technical breakdown that took place late in the previous week.DJ30 -25.61 NASDAQ -18.50 SP500 -3.12 NASDAQ Adv/Vol/Dec 811/689.1 mln/1549 NYSE Adv/Vol/Dec 1398/441.8 mln/1486
12:30 pm : The major indices have given up their gains and are now mixed as traders ready for the final half-hour of trading for the week. The Nasdaq leads the way lower with a loss of 0.4% while the Dow holds slightly in positive territory.
Retailers are underperforming despite today’s excitement over Black Friday, the busiest shopping day of the year. The SPDR S&P Retail Index (XRT $48.50, -$0.48) is lower by 0.9% after running to a gain of 0.7% early in the session. Online retailer Amazon (AMZN $182.00, -$6.99) is one of the worst performers in the space, trading down 3.8%. Home improvement stores Home Depot (HD $36.61, +$0.09) and Lowe’s (bby $22.83, +$0.35) are seeing outperformance while electronics retailer Best Buy (BBY $25.78, +$0.07) is also trending higher.DJ30 +14.50 NASDAQ -8.96 SP500 -0.03 NASDAQ Adv/Vol/Dec 972/536.4 mln/1321 NYSE Adv/Vol/Dec 1587/268.4 mln/1256
12:00 pm : Treasuries have slumped to their worst levels of the session as equity markets continue to hold solid gains. The complex has been under pressure all session long as money moves back into the equity complex. Selling of the 30-yr bond has intensified as it now trades down more than one and half points at 104 07/32. This morning's selloff has the 10-yr yield higher by eight basis points near 1.970% and has swung the yield curve steeper to almost 170 basis points.DJ30 +13.36 NASDAQ -7.82 SP500 +1.13 NASDAQ Adv/Vol/Dec 1229/443.3 mln/1045 NYSE Adv/Vol/Dec 1942/223.2 mln/875
11:30 am : The major averages continue to hold solid gains as both the Dow and S&P trade higher by 0.7%. The nasdaq has been the laggard all session long, currently higher by just 0.3%.
Shares of AT&T (T $27.68, +$0.13) are up 0.5% after the company announced it was withdrawing its T-Mobile merger plan from further consideration by the Federal Communications Commission. The company announced it will first focus on receiving approval from the U.S. Justice Department after it filed a lawsuit to block the merger. AT&T is setting aside $4 billion which it would need to pay T-Mobile’s parent company, Deutsche Telekom, should the deal collapse.DJ30 76.90 NASDAQ +6.24 SP500 +8.50 NASDAQ Adv/Vol/Dec 1372/363.8 mln/864 NYSE Adv/Vol/Dec 2088/183.8 mln/714
11:00 am : The major market averages continue to hold solid gains as markets near the halfway point of today’s trade. The Dow and S&P are setting the pace with gains of 0.7% while the Nasdaq lags with an advance of 0.5%.
Shares of Yahoo! (YHOO $15.17, +$0.23) are higher by 1.5% on news that it signed a nondisclosure agreement with Microsoft (MSFT $24.52, +$0.05). Microsoft last tried to buy Yahoo! in 2008 for $31 per share.DJ30 +81.29 NASDAQ +12.31 SP500 +8.57 NASDAQ Adv/Vol/Dec 1471/287.7 mln/724 NYSE Adv/Vol/Dec 2146/146.9 mln/632
10:30 am : The CRB Commodity Index is now up 0.3%, and trades near its best levels of the session.
Crude oil has seen a dramatic reversal off its session lows, and now trades up $0.80 near $97.00 per barrel.
Precious metals have run off their worst levels with strength coming as equity markets push higher. Gold prices are now flat at $1695 after trading down as much as 1.3%. Silver has climbed off its lows, but remains stuck in negative territory as it still trades down 0.9% at $31.60. DJ30 +87.91 NASDAQ +13.34 SP500 +9.05 NASDAQ Adv/Vol/Dec 1349/223.9 mln/764 NYSE Adv/Vol/Dec 1982/118.2 mln/705
10:00 am : The major market averages are holding just off of session highs as the Dow trades up close to 60 points.
Large financial institutions are leading today’s advance with shares of Citigroup (C $24.34, +$0.83) higher by 3.6% to pace the sector. Bank of America (BAC $5.27, +$0.13) and JP Morgan Chase (JPM $29.01, +$0.63) both trade higher by more than 2.0%.DJ30 +60.40 NASDAQ +9.26 SP500 +6.12 NASDAQ Vol 138.9 mln NYSE Vol 79.0 mln
09:45 am : Stocks have rebounded off their opening levels and now trade modestly higher in the opening minutes of trade. The S&P leads the advance with a gain of 0.6% while the Dow and Nasdaq each trade higher by 0.5%. Financials (+1.3%) are the best performing sector while health care (+0.1%) stocks lag. DJ30 +57.18 NASDAQ +12.44 SP500 +7.15 NASDAQ Vol 68.2 mln NYSE Vol 50.7 mln
09:13 am : [BRIEFING.COM] S&P futures vs fair value: -3.50. Nasdaq futures vs fair value: -13.00. Equity futures are pointing lower as the poor Italian bill auction has sparked more selling. Futures are off their worst levels of the session, but still looking at a modestly lower open (S&P -4 vs. fair value). Equity markets will close at 1 p.m. ET because of the Thanksgiving holiday.
09:00 am : [BRIEFING.COM] S&P futures vs fair value: -5.00. Nasdaq futures vs fair value: -13.80. The dollar index saw a recent push to session highs, and in the process hit its best level since January as it touched 79.70. The euro is once again under heavy selling pressure, trading down 105 pips near 1.3240 as today's Italian bill auction weighs. Today's selling has dropped the single currency back down to its October lows where it will look to hold support near 1.32. Selling are once again attacking the Australian dollar as the problems in Europe continue to cause an exodus out of the hard currency. The Aussie has tumbled more than 1000 pips since the end of October and is nearing critical support levels. At last look the Aussie was off 35 pips at .9700. Cautious commentary from S&P regarding the current debt levels of Japan has dropped the currency 55 pips to near 77.65 against the greenback.
08:27 am : [BRIEFING.COM] S&P futures vs fair value: -8.10. Nasdaq futures vs fair value: -19.20.
Overseas markets are lower today with Europe under pressure following the poor Italian auction and Asia seeing weakness on European debt worries. Italy's 6-month bill auction was deemed quite disappointing after drawing 6.504% and causing yields to surge along the Italian curve. The Italian 10-yr yield is now at a post-euro inception high near 7.30% with the 2-10-yr Italian spread now inverted and trading -43 bps. European markets (FTSE -0.4%, CAC -0.7%, DAX -0.6%) have recovered from their worst levels, but remain under pressure with financials holding up quite well. Financials trade mixed across the region with Commerzbank (+0.7%) and Royal Bank of Scotland (+2.1%) seeing gains while Deutsche Bank (-1.0%) and Societe Generale (-2.0%) are lower.
Asian markets (Nikkei -0.1%, Hang Seng -1.4%, Shanghai -0.7%) saw more selling as Japan's Nikkei tumbled to its lowest levels in almost 32 months while India's Sensex finished near 24-month lows. Financials and energy-related names were among the worst performers in the region as Shinsei Bank tumbled 5.2% in Tokyo and Woodside Petroleum plunged 5.8% in Sydney. Real estate stocks took a hit in Hong Kong as China Resources Land shed 2.8%.
07:59 am : [BRIEFING.COM] S&P futures vs fair value: -7.20. Nasdaq futures vs fair value: -20.80. Equity futures are off their worst levels of the session, but still trade modestly lower after a poor Italian bill auction provoked another round of selling. The 6-month bill auction drew 6.504% and caused a surge in Italian yields. The Italian yield curve has fallen further into inversion with the 2-10-yr spread now trading at -44 bps. Markets here in the U.S. will reopen after yesterday’s Thanksgiving holiday, but will see a shortened session end at 1 p.m. ET.
06:54 am : [BRIEFING.COM] S&P futures vs fair value: -8.10. Nasdaq futures vs fair value: -22.00.
06:54 am : Nikkei...8160.01...-5.20...-0.10%. Hang Seng...17689.48...-245.60...-1.40%.
06:54 am : FTSE...5102.15...-25.40...-0.50%. DAX...5403.60...-24.50...-0.50%.
Special thanks to Bloomberg, CNNMoney and Yahoo! Finance for their market summaries. 
Best Regards,
M.A. Perry
Trader and Founder of
WRB Analysis (wide range body/bar analysis)
Price Action Trading (no technical indicators)

@
http://twitter.com/wrbtrader and http://stocktwits.com/wrbtrader Phone: +1.708.572.4885
Business Hours: 8am - 5pm est (Mon - Fri)
Skype Messenger: kebec2002
questions@thestrategylab.comGo Back To TheStrategyLab.com Homepage