 Trade Results of M.A. Perry
 Trader and Founder of
WRB Analysis (wide range body/bar analysis)
Price Action Trading (no technical indicators)
Attachment:
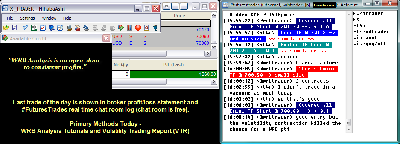 112111-wrbtrader-PnL-Blotter-Profit-1360.png [ 75.29 KiB | Viewed 275 times ]
click on the above image to view today's performance verification Trade Performance for Today: +13.60 points or
$1360 dollars in the Russell 2000 Emini TF ($TF_F) Futures.
Russell 2000 Emini TF Futures - 1 tick or 0.10 = $10.00 dollars and there's more contract information @
The ICE.
S&P 500 Emini ES Futures - 1 tick or 0.25 = $12.50 dollars and there's more contract information @
CMEGroup.
In addition, all trades were posted real-time in the
free #FuturesTrades chat room. Today's
#FuturesTrades trading chat room logs provides details (e.g. time, price, contract size) about each one of my trades from entry to exit along with price action commentary as the trade traversed...all archived
@ http://www.thestrategylab.com/ftchat/forum/viewtopic.php?f=96&t=1062.
To join our
free chat room...
registration instructions located at a different forum
@ http://www.thestrategylab.com/ftchat/forum/viewtopic.php?f=5&t=630Also, posted below are direct links to information about my
trade methodology and
trading plan (there's a difference between the two) that enables me to identify key trading areas in the price action that represent changes in supply/demand and volatility along with being able to exploit these changes via WRB Analysis (wide range body/bar analysis).
 WRB Analysis Tutorials
 @
http://www.thestrategylab.com/WRBAnalysisTutorials.htm and there's a
free study guide of the WRB Analysis Tutorial Chapters 1, 2 and 3 @
http://www.thestrategylab.com/tsl/forum/viewtopic.php?f=119&t=718.
Volatility Trading Report (VTR) @
http://www.thestrategylab.com/VolatilityTrading.htm and there's a
free trade signal strategy @
http://www.thestrategylab.com/tsl/forum/viewforum.php?f=89 so that you can freely test drive one of our trade strategies with support
prior to purchasing the Volatility Trading Report (VTR).
Trading Plan Daily Routine @
http://www.thestrategylab.com/tsl/forum/viewtopic.php?f=145&t=1269 -----------------------------
Market Summaries The below summaries by
Bloomberg,
CNNMoney and
Yahoo! Finance helps me to do a quick review of the fundamentals, FED/ECB/IMF actions or any important global economic events that had an impact on today's price action. Simply, I'm a strong believer that many variables (key market events) causes key changes in supply/demand and volatility that results in swing points and strong continuation price actions. Thus, I pay attention to these key market events from one trade to the next trade to give me the
market context for my
technical analysis. Just as important, these summaries becomes my
archives to allow me to understand what was happening on any given trading day in the past...something I can not get from my broker statements alone.
U.S. Stocks Slump on Lack of Supercommittee Accord Nov. 21 (Bloomberg) -- Bloomberg's Deborah Kostroun reports on the performance of the U.S. equity market today. U.S. stocks slumped, giving the Standard & Poor's 500 Index its longest decline since September, amid concern the U.S. government will be forced to submit to $1.2 trillion in automatic spending cuts.
Attachment:
 112111-Key-Price-Action-Markets.png [ 530.78 KiB | Viewed 273 times ]
 Market Update
 4:30 pm : Aggressive selling dropped the Dow more than 300 points before it began to fight back in afternoon action. Efforts to sell were largely debt driven.
Many market participants were put into a negative mindset with the technical breakdown last week. Their move to dump stocks came as Europe's bourses rolled over to resume their descent. Europe continues to wrestle with precarious financial conditions in both its periphery and its core -- Moody's even issued cautious comments about the outlook on France's debt rating. Traders were also agitated over the lack of progress made by U.S. officials in a recent attempt to arrange plans for shoring up fiscal conditions. The major equity averages were all down well in excess of 2% before stocks got any relief.
The market squeezed higher an afternoon trade right around the time that headlines indicated officials are moving forward on a plan to handle the U.S. deficit. Around the same time, Atlanta Fed President Lockhart was quoted for saying that he does not see risk of an outright recession, and that the risk of a recession stands at about 30%. Market participants may get more insight into the thinking of Fed members with the release of minutes from the most recent FOMC meeting tomorrow afternoon.
Although stocks were able to work their way up from session lows, the market never generated a great deal of momentum. That left stocks to still log sizable losses -- all 10 major sectors ended the day down 1% or more -- and give the S&P 500 its lowest close in more than a month.
Concerns about conditions in Europe and an aversion to risk prompted some to rotate into the dollar. As a result, the greenback gained ground against a basket of major foreign currencies. This morning the Dollar Index set a one-month high, but by session's end it was up a tame 0.3%.
Treasuries saw only limited interest amid the carnage, even after the latest auction of 2-year Notes saw very strong demand. The auction drew a bid-to-cover of 4.07, dollar demand of $142.5 billion, and an indirect bidder participation rate of 42.2%. Dollar demand was actually its strongest in more than 20 months.
Advancing Sectors: (None)
Declining Sectors: Telecom -1.1%, Utilities -1.2%, Consumer Staples -1.5%, Consumer Discretionary -1.5%, Materials -1.6%, Energy -1.7%, Health Care -1.9%, Tech -1.9%, Industrials -2.3%, Financials -2.5%DJ30 -248.85 NASDAQ -49.36 NQ100 -1.9% R2K -2.4% SP400 -2.0% SP500 -22.67 NASDAQ Adv/Vol/Dec 436/2.05 bln/2132 NYSE Adv/Vol/Dec 447/932 mln/2607
3:30 pm : Concerns about debt problems in Europe and the US pressured crude oil prices today. Futures settled lower by 0.8% at $96.92 per barrel. Crude put in lows at $95.24 in late morning trade but managed to bounce off those lows throughout the remainder of trade to recoup some losses. Natural gas closed higher by 2.7% at $3.41 per MMBtu. Futures rallied sharply into positive territory, notching highs at $3.44, in late morning trade. They did pull back from those highs in the afternoon session.
Margin selling, caused by the sharp pullback in equities, pressured gold and silver today. Gold price shed 2.7% to settle at $1678.60 per ounce, while silver prices dropped 4.1% to end at $31.07 per ounce. Today's lows, at $1670.50 and $30.65, are the metals worst in around 1 month.DJ30 -213.92 NASDAQ -39.99 SP500 -25.24 NASDAQ Adv/Vol/Dec 469/1.7 bln/2086 NYSE Adv/Vol/Dec 471/624.5 mln/2603
3:00 pm : Stocks have been unable to build enough momentum from their recent run to help stocks further pare losses. In turn, the major averages continue to wrestle with losses on the order of 2%.
Amid the persistent weakness the Volatility Index is up about 4% at the moment. That's less than half the increase that it had displayed while at its session high in late morning action. Still, the VIX never came in contact with the levels that were set late last week. DJ30 -255.81 NASDAQ -51.55 SP500 -23.21 NASDAQ Adv/Vol/Dec 435/1.43 bln/2115 NYSE Adv/Vol/Dec 380/520 mln/2660
2:30 pm : Stocks recently made an abrupt bounce then began to squeeze higher. The move coincided with headlines that the Fed's Lockhart does not see risk of an outright recession. He did say that the risk of a recession stands at about 30%, however. Separate reports suggest that U.S. officials are moving forward on a plan to handle the country's deficit after many reports this morning indicated that the efforts of officials failed during the weekend.DJ30 -256.16 NASDAQ -51.57 SP500 -23.76 NASDAQ Adv/Vol/Dec 405/1.31 bln/2135 NYSE Adv/Vol/Dec 340/475 mln/2695
2:00 pm : The stock market's effort to work its way up from session lows has lost momentum, leaving stocks to drift along with steep losses. The market's move higher was checked at the same time that the greenback began to reclaim its gain -- it is now up about 0.4% against a collection of competing currencies after it had been up only 0.1% not long ago.DJ30 -314.39 NASDAQ -63.01 SP500 -29.01 NASDAQ Adv/Vol/Dec 405/1.20 bln/2115 NYSE Adv/Vol/Dec 325/440 mln/2690
1:30 pm : Results from an auction of 2-year Notes were released at 1:00 PM ET. The auction saw very strong demand. In fact, dollar demand was the most since February 2010. Still, neither Treasuries nor stocks have shown much of a reaction to the numbers.
As for specifics, the auction drew a bid-to-cover of 4.07, dollar demand of $142.5 billion, and an indirect bidder participation rate of 42.2%. For comparison, the prior auction attracted a bid-to-cover ratio of 3.64, dollar demand of $127.4 billion, and an indirect bidder rate of 39.2%. Over the past six auctions, the bid-to-cover has averaged about 3.42, dollar demand has trended around $119.8 billion, and the indirect bid has been at about 39.0%. DJ30 -299.71 NASDAQ -58.27 SP500 -26.87 NASDAQ Adv/Vol/Dec 405/1.10 bln/2115 NYSE Adv/Vol/Dec 315/405 mln/2700
1:00 pm : Spooked by the specter of contagion, market participants are slashing risk aggressively today. The effort has taken stocks to new monthly lows.
Market conditions have turned tenuous after a technical breakdown last week and weekend reports that U.S. officials apparently prefer to draw lines between political parties than progress in their efforts to get a grip on problematic fiscal conditions. Still, things remain more threatening across the Atlantic, where Europe's leaders continue to come up short in shoring up the continent's financial conditions. Analysts at Moody's reminded market participants that the troubles of Europe aren't restricted to countries in the continent's periphery by issuing cautious comments about the outlook on France's debt rating.
Such macro concerns have spared few stocks. In fact, about 99% of the issues in the S&P 500 were in the red when stocks were at session lows. Even though the stock market has slowly worked its way up from the depths that were set late this morning, weakness remains widespread.
Financials have been some of this session's poorest performers, mostly because many are fearful of the exposure of bank stocks to Europe. The sector is presently down 2.5%. However, a 2.7% loss for industrials makes them this session's worst performing sector.
Traditional safe havens like Treasuries and the dollar have only attracted modest buying interest today. In turn, gains by the benchmark 10-year Note have been capped at about a half point. Meanwhile, the greenback has given up most of its morning gain so that it is now up a relatively tame 0.2% against a collection of competing currencies. Gold has been unable to separate itself from the rest of the commodity complex, which is under sharp pressure. In turn, the yellow metal is down nearly 3% to $1680 per ounce. DJ30 -304.29 NASDAQ -60.74 SP500 -28.34 NASDAQ Adv/Vol/Dec 365/995 mln/2135 NYSE Adv/Vol/Dec 270/375 mln/2720
12:30 pm : Even though the dollar has surrendered some of its gain in recent trade, gold prices are coming under increased selling pressure. As a result, the yellow metal is now down more than 3% at about $1670 per ounce. Gold prices are still up about 18% for the year, though.DJ30 -326.92 NASDAQ -65.78 SP500 -30.45 NASDAQ Adv/Vol/Dec 335/900 mln/2155 NYSE Adv/Vol/Dec 260/340 mln/2725
12:00 pm : The stock market is trading only modestly above its session low. Despite the extent of its loss today, Treasuries aren't really attracting a great deal of buying interest. In turn, the yield on the benchmark 10-year Note is staying only a few basis points shy of 2.0%. Volatility among Treasuries could pick up with the release of results from an auction of 2-year Notes at 1:00 PM ET.
The dollar had benefited from the safety trade this morning, but it has been handing over gains in recent action. The greenback is now up only 0.1% against a basket of major foreign currencies. DJ30 -295.13 NASDAQ -61.85 SP500 -27.57 NASDAQ Adv/Vol/Dec 340/805 mln/2150 NYSE Adv/Vol/Dec 250/305 mln/2730
11:30 am : The major averages have moved up modestly from their session lows, but losses remain substantial amid widespread weakness.
Financials continue to wrestle with some of the most aggressive selling efforts, largely because of concern about the exposure of banks to the precarious conditions in Europe. As such, the KBW Bank Index is down 3% today. DJ30 -303.47 NASDAQ -63.47 SP500 -28.12 NASDAQ Adv/Vol/Dec 300/685 mln/2150 NYSE Adv/Vol/Dec 245/255 mln/2700
11:00 am : Following a failed attempt to stabilize, stocks have descended to new session lows. As a result, the Dow is now down 300 points and every one of its 30 components is in the red. Meanwhile, nearly 99% of the stocks in the S&P 500 are trading with losses.DJ30 -305.23 NASDAQ -30.29 SP500 -67.65 NASDAQ Adv/Vol/Dec 315/485 mln/2085 NYSE Adv/Vol/Dec 265/190 mln/2625
10:30 am : An effort to trim risk has extended to commodities. In turn, the CRB Index is down 1.3%. Among its more closely tracked components, oil prices are near session lows with a loss of about 2% at $95.90 per barrel. Oil prices have been under pressure all session. Natural gas prices have been more stable this morning. The energy component was last quoted with a 0.3% loss at $3.49 per MMBtu, which is right about where it was when trade opened.
As for precious metals, gold prices have extended their decline, such that the yellow metal now trades with a 1.4% loss at $1700.70 per ounce. Silver has fallen under especially sharp selling pressure. The metal was most recently quoted with a 4.2% loss at $31.05 per ounce, which is only narrowly above its session lowDJ30 -244.56 NASDAQ -55.26 SP500 -25.05 NASDAQ Adv/Vol/Dec 300/385 mln/2070 NYSE Adv/Vol/Dec 235/150 mln/2630
10:00 am : Stocks are stuck near session lows, leaving the Dow to wrestle with a 200-point loss. There hasn't even been a positive response to the latest existing home sales numbers, which climbed to an annualized rate of 4.97 million units in October from a rate of 4.90 million units in the prior month. Economists polled by Briefing.com had expected, on average, that existing home sales would ease to an annual pace of 4.85 million units.DJ30 -205.79 NASDAQ -51.28 SP500 -22.47 NASDAQ Adv/Vol/Dec 250/120 mln/1990 NYSE Adv/Vol/Dec 215/70 mln/2500
09:45 am : Stocks are down sharply in the opening minutes of trade. The slide has the S&P 500 at a new one-month low and beneath its 50-day simple moving average for the first time since October 7.
Weakness is widespread with all 10 major sectors in the red, but energy stocks and financials are in the worst shape. The two sectors are down 2.3% and 2.1%, respectively. Utilities and consumer staples stocks make up the only two sectors that have limited losses to less than 1%, but they are still down 0.8% and 0.9%, respectively. DJ30 -187.09 NASDAQ -45.97 SP500 -21.00 NASDAQ Adv/Vol/Dec NA/NA/NA NYSE Adv/Vol/Dec NA/NA/NA
09:15 am : S&P futures vs fair value: -17.40. Nasdaq futures vs fair value: -26.80. Debt concers continue to drive sellers to action, leaving broad market stock futures to lag fair value by more than 1% this morning. With stocks in such weak shape ahead of the open, Treasuries and the dollar have come into stronger demand. However, the greenback's gain, which currently stands at about 0.4%, has prevented many participants from seeking safety in precious metals. In fact, most commodities have been caught up in selling interest this morning. There hasn't been any corporate news significant enough to distract traders from the debt troubles of Europe and the inability of U.S. officials to make progress in shoring up fiscal conditions at home. Economic data is limited to monthly existing home sales numbers, which are due at 10:00 AM ET.
09:05 am : S&P futures vs fair value: -15.10. Nasdaq futures vs fair value: -24.00. Soured sentiment among global participants has permeated commodity pits. That has the CRB Commodity Index down by 0.5%. Crude oil prices have been clipped by 1.3% so that they now trade at $96.40 per barrel. Natural gas prices are down a less significant 0.2% to $3.50 per MMBtu. A stronger greenback has prevented many from seeking safety in precious metals. In turn, gold prices are down 0.7% to $1713 per ounce while silver prices trade at $31.30 per ounce for a 3.4% loss.
08:35 am : S&P futures vs fair value: -16.00. Nasdaq futures vs fair value: -23.30. Debt-related troubles in Europe continue to drive concerns of contagion in both the eurozone periphery and core, especially after analysts from Moody's made some cautious comments about France's rating outlook. France's CAC has fallen to a 2.6% loss. All 40 of its components are in the red, but financial outfits Societe Generale and BNP Paribas are in the worst shape. Britain's FTSE is currently off by 1.9%. Lloyds Group (LYG 1.58, +0.00) and Rio Tinto (RIO 48.87, -2.76) are its two poorest performers by percent lost. Losses by all 30 members of the DAX have the German bourse down 2.5%. Man SE, Volkswagen, and Deutsche Bank (DB 35.13, -1.44) are under the most pressure.
Overnight action in Asia took Japan's Nikkei down 0.3%. Tokyo Electric, Mazda Motor, and Fuji Heavy Equipment were sources of weakness, but Olympus Corp offered strength as it rallied after a couple of weeks of volatile trade. Hong Kong's Hang Seng fell 1.4%. Agricultural Bank of China fueld weakness in financials, which collectively cast a heavy drag on broader action. Mainland China's Shanghai Composite closed flat in its first session of the new week. Financial issues also weighed on trade there, but select natural resource plays, like steel and metals stocks, offset their weakness.
Note: all ticker quotes reflect pre-market prices.
08:05 am : S&P futures vs fair value: -18.60. Nasdaq futures vs fair value: -26.30. The S&P 500 just endured its worst week in more than a month, but market participants continue to apply pressure. Difficulties related to debt-cutting efforts in both Europe and the U.S. are stoking additional selling interest. Earnings are limited this morning, but a few new corporate deals have been struck. Meanwhile, the economic calendar is light; it features existing home sales numbers at 10:00 AM ET. Results from the latest auction of 2-year Notes are scheduled for 1:00 PM ET.
06:50 am : [BRIEFING.COM] S&P futures vs fair value: -20.10. Nasdaq futures vs fair value: -29.00.
06:50 am : Nikkei...8348.27...-26.60...-0.30%. Hang Seng...18225.85...-265.40...-1.40%.
06:50 am : FTSE...5253.03...-109.90...-2.10%. DAX...5645.52...-154.70...-2.70%.
Special thanks to Bloomberg, CNNMoney and Yahoo! Finance for their market summaries. 
Best Regards,
M.A. Perry
Trader and Founder of
WRB Analysis (wide range body/bar analysis)
Price Action Trading (no technical indicators)

@
http://twitter.com/wrbtrader and http://stocktwits.com/wrbtrader Phone: +1.708.572.4885
Business Hours: 8am - 5pm est (Mon - Fri)
Skype Messenger: kebec2002
questions@thestrategylab.comGo Back To TheStrategyLab.com Homepage


