Hi vagalume,
I edited your chart (reposted below) to show my commentary. Basically, WRB Analysis Tutorials can help your strategy via different ways. It can improve your entry, improve your exits or both. The most common benefit is exits involving profit targets or early warning signs that the trade has enter a price area that may trigger a retracement...that warning allows you to take an early profit or can be used to trigger moving your initial stop/loss protection into a profitable trailing stop.
As for your entry...that's were you and I need to work together to see if the WRB Analysis Tutorials can help in that particular area.
Let me know if you want to try the 30 day free trial and I'm only asking because I've notice some members haven't downloaded the information after I've set them up for access...essentially wasting my time & energy in setting them up. Simply, for now on I just ask if you want access to the 30 day free trial to the basic WRB Analysis Tutorial Chapters 1, 2 and 3.
Once again, do you want access to the 30 day free trial.

Best Regards,
M.A. Perry
Attachment:
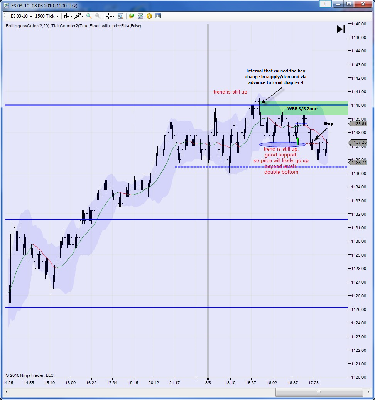 vagalume_ES_1500tick.png [ 450.93 KiB | Viewed 424 times ]
vagalume wrote:
I am trading only on price action. I am looking for visual support and resistance lines, wich are obvious to see for everybody and were price bounced at least once before. The I entre the trade following the 1-2-3 pattern (according to Joe Ross and others). Time frame on the ES is 1500 tick. target is the next resistance/support level. Stop is one tick below/above the last pivot for the long/short. I only trade in the direction of the major trend, which is in this picture "up".
As you can see this trade I posted here I was stopped out.
(You can also see a bollinger band but which I only use for visual aid. It's not used for the entry or exit)
So my question is: Where and how could the WRB strategy help me not entrering this trade or getting better trades)

