TheStrategyLab.com Price Action Trading Support Forum
http://www.thestrategylab.com/tsl/forum/

DK CH 2
http://www.thestrategylab.com/tsl/forum/viewtopic.php?f=61&t=4257
Page 1 of 1

Author:  Icytrader [ Sun Oct 20, 2019 4:36 pm ]
Post subject:  DK CH 2

Here are a couple of examples of WRB in the daily RUT chart.

I currently don't have a trading signal, or strategy for this.
I just trade neutral options spreads with out doing much technical analysis.

I would like to have access to the FVB Trade Signal Strategy.

I will buy the VTR.

Hans

Attachments:
Swing point 1.png
Swing point 1.png [ 70.45 KiB | Viewed 338 times ]
Swing point 2.png
Swing point 2.png [ 72.89 KiB | Viewed 312 times ]

Author:  wrbtrader [ Tue Oct 22, 2019 9:58 pm ]
Post subject:  Re: DK CH 2

Hi Icytrader,

I've been well enough to post the recent two days and catching up on emails. Yet, I'm still in the hospital...hopefully I'll be released tomorrow.

There's a few things you need to remember about tutorial chapter 2. The key criteria is a key market event (KME) that's involved with a swing point or strong continuation price action. Also,make a list on paper for each with the rules that you think are important to remember...that's discussed price action definitions.

Re-write my rules in a way that's easier for you to remember.

With that said...both your DOK charts for tutorial chapter 2 do not mention / identify the key market event. Also, its important to name the trading instrument for the charts and show on the axis the time frame. This is important for the reader to be able to look at the info via their own charts for those that want to verify what you see or a veteran user of WRB Analysis may see something you didn't see that can be exploited for the next trading session.

Back to you listing the rules on paper for each price action definitions and then keep it organize in a folder on your desk.

In addition, do not forget the DOK for tutorial chapter 1 in which you identify WRB intervals and WRB Hidden GAP intervals to verify that you're able to recognize them on your charts.

Last of all, I'm slow to respond to emails, private messages and questions in the private threads. I'll now only let Huey manage the private threads and I'll answer these public questions until I'm ready to take control of everything again.

Regards,
M.A. Perry
TheStrategyLab.com
wrbtrader@gmail.com

Author:  Icytrader [ Wed Oct 23, 2019 6:39 pm ]
Post subject:  Re: DK CH 2

Here is a better annotated example that includes a KME and WRB after it.
The WRB is not a HG but next bar after it has a HG.

Attachments:
CH2 KME.png
CH2 KME.png [ 122.96 KiB | Viewed 323 times ]

Author:  wrbtrader [ Thu Oct 24, 2019 10:18 am ]
Post subject:  Re: DK CH 2

Hi Hans,

The problem with this DOK is the WRB Hidden GAP interval.

Up WRB Hidden GAP interval:

1) Ensure its an Up WRB interval
2) Examine the interval before the Up WRB and then examine the interval after the Up WRB.
3) Using only the two intervals (before & after) the Up WRB...you compare the area between the High for the before interval and the Low for the after interval.

If there's a gap between the before (high) interval & after (low) interval...that gap converts the Up WRB interval into an Up WRB Hidden GAP interval.

Down WRB Hidden GAP interval:

1) Ensure its a Down WRB interval
2) Examine the interval before the Down WRB and then examine the interval after the Down WRB.
3) Using only the two intervals (before & after) the Down WRB...you compare the area between the Low for the before interval and the High for the after interval.

If there's a gap between the before (low) interval & after (high) interval...that gap converts the Down WRB interval into an Down WRB Hidden GAP interval.

Simply, it looks like in your charts..you have only been looking for Hidden GAP areas. Instead, you should be looking for only one interval as a WRB + Hidden GAP area = WRB Hidden GAP interval. Therefore, the Hidden GAP interval must be the same WRB interval.

The mistake in your DOK chart, you identified a WRB interval and then you identified a different interval as the Hidden GAP interval.

You must identify only one interval as both the WRB & Hidden GAP.

Another member made the same mistakes. She fixed it by first looking for WRB intervals and then looking to see which of the WRB intervals qualified also as a WRB Hidden GAP interval. In contrast, she made too many errors when she first looked for Hidden GAP intervals. Thus, she was identifying Hidden GAP intervals that were not also a WRB interval.

I attached a Emini ES futures chart of a Up WRB Hidden GAP interval.

Attachment:
Price-Action-WRB-Hidden-GAP-Interval.png
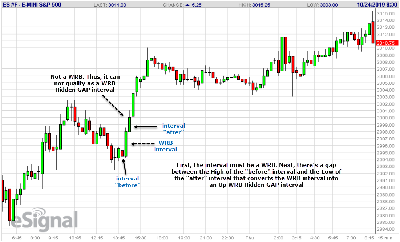
Price-Action-WRB-Hidden-GAP-Interval.png [ 95.34 KiB | Viewed 328 times ]

P.S. The chart above does not show the KME.

Regards,
TheStrategyLab
M.A. Perry
wrbtrader@gmail.com

Author:  Icytrader [ Thu Oct 24, 2019 6:07 pm ]
Post subject:  Re: DK CH 2

Thanks for the input Mr. Perry

Here is a couple of WRB HGs in the 6C 5 min
2 KMEs one after the other.


Hans

Attachments:
CH2 WRBHGs.png
CH2 WRBHGs.png [ 124.28 KiB | Viewed 316 times ]

Author:  wrbtrader [ Thu Oct 24, 2019 9:32 pm ]
Post subject:  Re: DK CH 2

Hi Hans,

Thanks for the DOK and the identification of WRB Hidden Gap intervals. Also, there are other WRB Hidden GAP intervals on your chart.

Regards,
TheStrategyLab
M.A. Perry
wrbtrader@gmail.com

Author:  Icytrader [ Fri Oct 25, 2019 4:10 am ]
Post subject:  Re: DK CH 2

That is correct, included is the chart with the WRBHGs.

Attachments:
CH2 WRBHGs.png
CH2 WRBHGs.png [ 227.68 KiB | Viewed 315 times ]

Page 1 of 1 All times are UTC - 5 hours [ DST ]
Powered by phpBB © 2000, 2002, 2005, 2007 phpBB Group
http://www.phpbb.com/