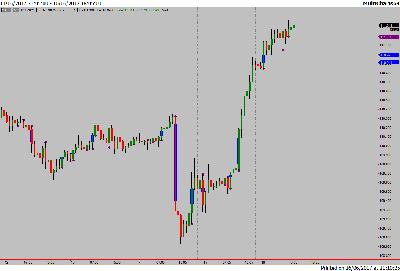
WRB and WRB hidden Gap standard 3 bar lookback purple dot marks WRB blue background WRB hidden gap.
Attachment:
 MultiCharts13.png [ 49.41 KiB | Viewed 647 times ]
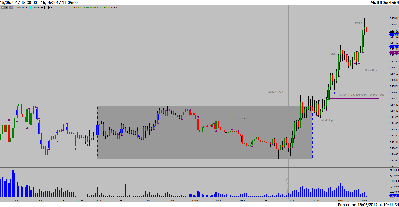
Yesterdays Bank of England (KME) announcement caused some volatility
Attachment:
 MultiCharts10.png [ 69.25 KiB | Viewed 506 times ]
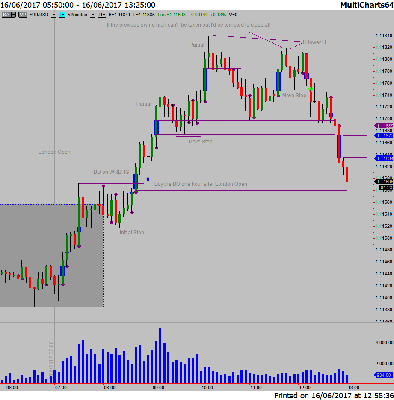
The next chart shows a hypothetical trade based around a strategy called 'The London Open'. It is based on the fact that statistically European denominated currencies often put in an extreme (high or low of the day) within the first hour of the London session. (when I last checked I believe it was around 50% of the time considering there are 24 hours in a day thats pretty significant).
A break out of this first hour range is taken. A WRB can be used to add confidence that a directional move is under way. I should say I don't trade this strategy. It is interesting to me from a 'hobbyist' point of view, developing an algorithm to trade it automatically. One day perhaps.
Attachment:
 MultiCharts11.png [ 80.11 KiB | Viewed 580 times ]
Same 'trade' considering closing
Attachment:
 MultiCharts15.png [ 53.38 KiB | Viewed 524 times ]
Opted to move stop after newly formed WRBHG zone
Attachment:
 MultiCharts16.png [ 53.67 KiB | Viewed 509 times ]
Final Chart Showing stop profit (green *) just as market changed from long to short. Lower High, Swing low break just as WRBHG build above and price breaks previous WRBHG below.
Attachment:
 MultiCharts17.png [ 56.11 KiB | Viewed 513 times ]

