Hi,
Thanks for the chart DOK.
I see something wrong about your strong continuation definition #1 price action. The strong continuation #1 price action involves
"reaction highs or reaction lows".
Your chart does not discuss any information involving reaction highs/lows...that's an error because you're ignoring or forgetting to
show the key concepts on your chart about strong continuation price action definition #1.
Quote:
Note: I see a reaction high price action on your chart but you did not mention anything about it on your chart. Therefore, its the only reason why I assume you've forgotten or didn't know its a key concept for strong continuation #1 price action definition.
Therefore, please read again strong continuation #1 and #2 price action definitions. Make sure
your charts show the following key concepts or discuss it as words in the message post to explain what is happening in the chart.
Strong Continuation definition price action #1 - The key concept involves reaction highs/lows.
Strong Continuation definition price action #2 - The key concepts involves v2 interval, contracting volatility intervals and v1 interval.
Read all the rules again very carefully. Make a check list and go through your check list to ensure all rules have been qualified. Next, in your DOK...show the key concepts.
-----------
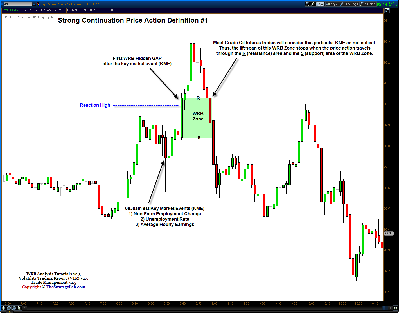
I've added two DOK charts to show you a good DOK examples for tutorial chapter 2. More importantly, I've shown charts with different types of WRB Zones generated from the same Key Market Event + First WRB Hidden GAP + Strong Continuation Price Action Definition #1 (reaction highs/lows). Please study them very carefully so that you can understand why the "lifespan" of a WRB Zone will change due to the KME being hyped (constantly talked about as being critically important).
The chart below involves the WRB Zone being used as a miscellaneous change in supply/demand. Thus, the lifespan of the WRB Zone ends when it gets filled as shown on the chart.
Attachment:
 011014-Crude-Oil-CL-Futures-Strong Continuation-Definition-1-DOK-Miscellaneous-KME.png [ 68.43 KiB | Viewed 317 times ]
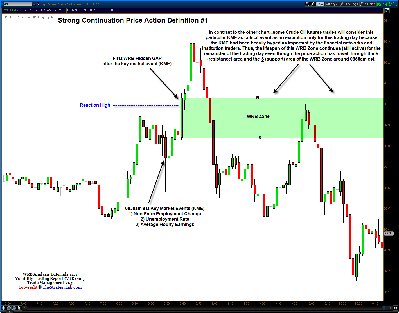
The chart below involves the same WRB Zone being used as a
critical change in supply/demand and critical change in volatility for Crude Oil futures traders due to the hyping (constant talking by financial networks and institutional traders that its a critical event they're watching) of the KME all week for several trading days
prior to the KME. The lifespan of a critical KME does not end when it gets filled. In contrast, it remains active for the remainder of the trading day even if its filled in multiple times by the price action traveling through the WRB Zone. Yet, don't get confused about critical KMEs...if the associated WRB Zone to the KME remains unfilled by the end of the trading day...the WRB Zone can continue being used to look for trade opportunities into the next trading day and further until the WRB Zone is filled in by the price action traversing through the WRB Zone.
Attachment:
 011014-Crude-Oil-CL-Futures-Strong Continuation-Definition-1-DOK-Critical-KME.png [ 76.45 KiB | Viewed 326 times ]
Regards,
M.A. Perry

