|
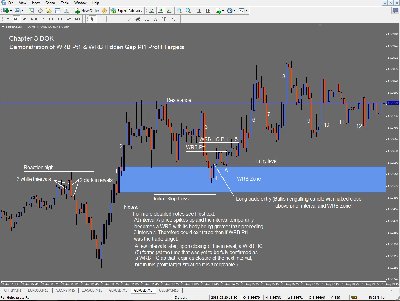
On the attached chart I show an example of a possible trade on GBPUSD on 20/08/2013 (5min. chart) with targets based on the Chapter 3 methods 1 & 2 (using WRB Pt1 and WRB Hidden Gap Pt1).
Price was in a strong uptrend, and at 08:05 (UTC) a WRB Hidden Gap (1) formed followed by another (2) 2 intervals later. After the No.2 formed this confirmed No. 1 was a valid WRB Zone based on Strong Continuation Price Action Definition #1.
(Defined as producing two or more same color WRB Hidden GAPs (they don't need to occur consecutive as in back to back) in which one of the WRB Hidden GAPs is the first WRB Hidden GAP as a breakout interval above the most recent reaction high (bullish continuation) or below the most recent reaction low (bearish continuation) price action before the next swing point.
Reaction High - Price action had a minimum of two consecutive white intervals (Close > Open) with higher closes before the reaction high and then price decline after the reaction high to produce a minimum of two consecutive dark intervals (Open > Close) with lower closes.)
Price continued up until it hit resistance (Blue line). After several attempts at breaking through the resistance, price dropped back with a bearish WRB HG (3) forming on its way to filling WRB HG (2).
Price entered the WRB Zone, 2 intervals later a bullish engulfing interval formed breaking above the previous interval and (new) resistance at the top of the WRB zone. This would be the trigger for a long trade entry.
WRB Pt1 formed a few intervals later. Then WRB HG Pt1 a few intervals after that as indicated on attachment.
In hindsight WRB HG Pt2 (6) looked like the best place to exit, just below resistance (blue line).
However, in reality if the Stop Loss had been trailed up to near entry level, the trade might have been stopped out at interval labeled B.
| Attachments: |
Richards DOK Chapter 3.jpg [ 252.37 KiB | Viewed 412 times ]
|
_________________
Everything will be all right in the end... if it's not all right then it's not yet the end
|

