Below is a great article for Energy traders written by Aaron Fennell @
InsideFutures.com ------------------
What Traders Should Watch this Hurricane SeasonFriday, June 04, 2010
by
Aaron Fennell of
Lind-Waldock This year’s hurricane season could prove to be an active one. There are some factors energy traders need to keep in mind regarding how the markets will react as any storms develop, and the differences in volatility between various products.
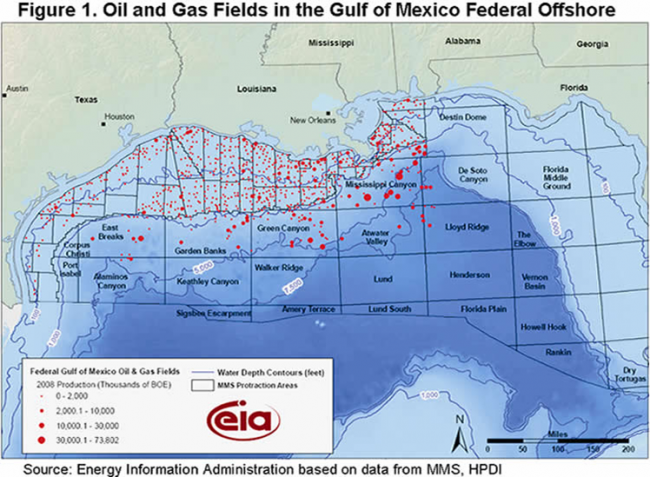
Hurricanes often move through the Gulf of Mexico, which contains an extensive network of infrastructure supporting the oil industry. Oil tankers need to pass through the Gulf and offload crude oil, there are offshore drilling rigs that can get knocked off their moorings, and evacuation is often required. All these factors can disrupt or limit natural gas and crude oil supplies. Traders should attempt to anticipate the progress of hurricanes to determine the direction of the energy markets, but sometimes traders don’t have all the necessary facts and the market doesn’t move as expected.
This Year’s ForecastTypically the hurricane season starts in August and runs into late October or early November. We’ve already had one tropical storm in the Eastern Pacific, Agatha, which came remarkably early.
The National Hurricane Center recently released an extremely detailed forecast for the 2010 season. It is predicting an above-normal to extremely active hurricane season this year. There is an estimated 70 percent probability for 14-23 named storms, 8-14 hurricanes, and 3-7 major hurricanes. It doesn’t take long for a minor hurricane to move from Category 3 to Category 5 (it can happen in a day or two), so they are all important to follow if you trade the energy markets.
An accumulated cyclone energy range of 155 percent to 270 percent of the median is expected. This is a measure of the amount of force in a hurricane. By all measures, it looks like it could be a strong season, as we are also in a cycle of high hurricane activity.
The reasons for this forecast were stated as:
• The tropical multi-decadal signal, which has contributed to the ongoing high-activity era for Atlantic hurricanes that began in 1995.
• A continuation of exceptionally warm sea surface temperatures in the Main Development Region, which includes the Caribbean Sea and tropical Atlantic Ocean.
• Either ENSO-neutral or La Nina conditions, with La Nina becoming increasingly likely.
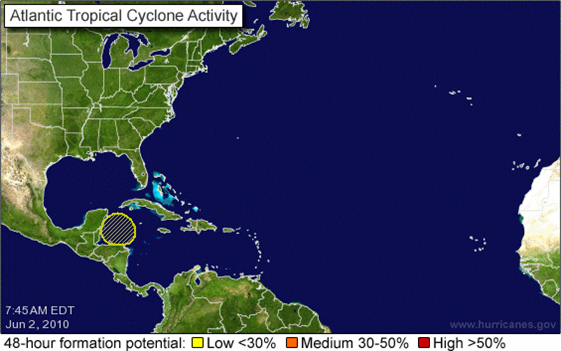
Hurricane Watching The National Oceanic and Atmospheric Administration (NOAA)’s National Hurricane Center has a map on its Web site of tropical depressions that are developing. Over time, the depressions move across the Atlantic Ocean and over the Caribbean, and often will change to tropical storms, and then to hurricanes. Often storms curve northward in a clockwise fashion. Sometimes a hurricane will move up toward Bermuda and not near the Gulf of Mexico, or move very far south in the Caribbean. The dangerous ones in terms of energy market impact are of course the ones that curve toward the key oil refining region, the Gulf.
Traders often think hurricanes develop out of nowhere, with no warning. However, tropical depressions appear about two weeks before they grow in velocity and become a big enough problem and capture the attention of the news media. Sometimes you hear of hurricanes along Pacific Coast, and the market may spike on that information because participants aren’t paying attention to the location. Those hurricanes aren’t going to affect energy infrastructure. Before reacting to a headline of a storm or hurricane developing, look at its location and likely path and whether it will become a potential threat to oil-producing areas.
At this time, things look all clear on the NOAA map. Definitely have a look at the National Hurricane Center site. It’s an invaluable resource.
NOAA Map:
http://www.nhc.noaa.gov BP Oil Spill
There has been some speculation about whether the BP oil spill in the Gulf of Mexico will influence the strength or frequency of hurricanes this season. There are some theories that speculate it could change the rate of moisture entering the air from the ocean surface. However, while it might temporarily stall that energy out over the open ocean, it wouldn’t ultimately have a measurable impact as storms can quickly regain momentum. According to the NOAA, it is unlikely the oil spill will have much impact in that regard.
However, hurricanes can impact which direction the oil slick will move and how it spreads. A storm surge can cause the oil to move higher onto beaches and into the land. Oil mixed with chemical dispersants kills marsh grasses along the Gulf, it can also increase erosion. If there is a small silver lining to be found, the agitation of the water resulting from a hurricane would cause the oil to naturally biodegrade faster.
Oil and Gas FieldsThe oil-producing region starts around Alabama, and runs through the southern coast of Texas. That’s the area to focus on when watching the path of a storm. The Henry Hub delivery point for NYMEX natural gas futures contracts is located in Southern Louisiana. Henry Hub took almost a direct hit from Hurricane Katrina in 2005.
 Market Reaction: Natural Gas and Oil
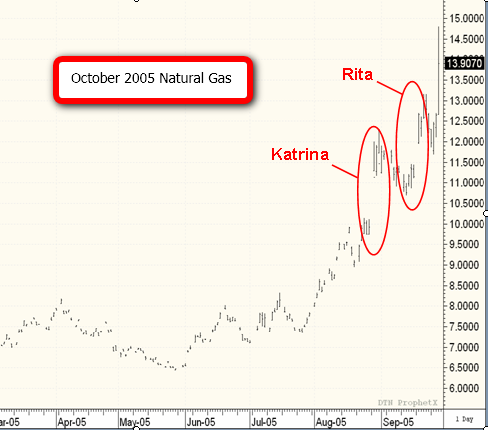
Looking back on the 2005 season, Hurricane Katrina moved into the region on a Friday when the market was closed, and it was only a Category 3 storm moving across Florida. By Sunday night, it had been upgraded to Category 5. Natural gas gapped dramatically higher at the open Sunday evening for the trading session on Monday. Many investors who had short positions on in this market were facing large losses.
Then Hurricane Rita struck, and caused another market gap and spike higher. It didn’t prove to be a dangerous storm, but market participants were still shell-shocked from Katrina and the reaction in the October 2005 futures contract was overly dramatic. If you were trading the February 2006 contract, there was much less volatility as the market expected that even if there was storm damage, supplies would be back on line by the February delivery period.


It’s important to know how the spread between various delivery months can change. If there is a delay in the movement of supplies or damage to infrastructure, it can cause a dramatic move in one month but not in another. We saw this in 2005 as the October natural gas contract spiked (which was coming up for delivery soonest) but the February 2006 contract didn’t. The spread between the two narrowed to about $0.60 per mmBtu, which is very narrow in relation to the normal spread of about $1.40. Volatility was dramatic. If you trade the spreads in this market, you need to be aware of the impact on various contract months.
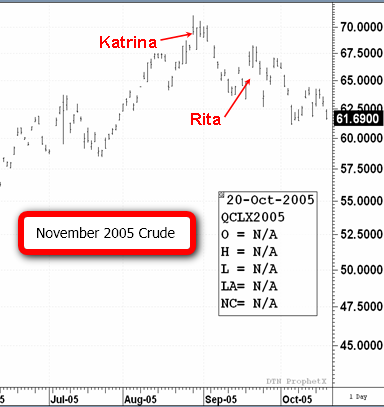
The crude oil market did not react as much as one might expect when Katrina and Rita struck. We saw spikes, but the market quickly fell off. There were two reasons for this: First, there was concern about an economic slowdown in the aftermath of Katrina that would ultimately result in lower demand. Second, crude oil is a more global commodity that is not as sensitive to local supply issues.
One storm in one region doesn’t have a dramatic impact on overall supplies in terms of the percentage of the overall global market. It is easier to replace the disrupted crude oil supply than it is to replace natural gas supply. There are shipments available from the North Sea, Venezuela, or elsewhere that can be moved via tanker.
Natural gas, on the other hand, is land-locked and difficult to move overseas. There is a North American market and a European market, and they aren’t linked. It’s expensive and impractical to move natural gas from one market to another on separate continents. Therefore, the disruption is more proportional on the natural gas side.
Trading Strategy The natural gas futures contracts have seen a recent range of about $4.00 - $4.50. There is good support around $4.30 in the back-month October contract, and I believe purchasing contracts at $4.40 or below and trading the range is a good strategy right now. Nearing August, you might want to hold positions more aggressively and watch for tropical depressions that could result in market spikes. It is difficult to consider natural gas much below $4 during an active hurricane season.
In addition, a hot and/or dry summer is also going to fuel demand natural gas for air conditioning demand. Further, a dry summer will result in reduced hydro-electric production, which will transfer demand toward natural-gas driven electricity generation. Overall, I think the outlook for natural gas this summer is positive.
Aaron Fennell is a Senior Market Strategist based in Lind-Waldock’s Toronto office, and is serving clients in Canada. If you would like to learn more about futures trading you can contact him at 877-840-5333, or via email at
afennell@lind-waldock.com.
The data and comments provided above are for information purposes only and must not be construed as an indication or guarantee of any kind of what the future performance of the concerned markets will be. While the information in this publication cannot be guaranteed, it was obtained from sources believed to be reliable. Futures and Forex trading involves a substantial risk of loss and is not suitable for all investors. Past performance is not indicative of future results. Please carefully consider your financial condition prior to making any investments. Not to be construed as solicitation.
Lind-Waldock, a division of MF Global Canada Co.
MF Global Canada Co. is a member of the Canadian Investor Protection Fund.
(c) 2010 MF Global Holdings Ltd.
Futures Brokers, Commodity Brokers and Online Futures Trading. 123 Front St. West, Suite 1601, Toronto, ON M5J2M2. Toll-free 877-501-5463.
Recent articles from this author * The Carry Trade Demystified: Opportunities Abound - Tuesday, August 03, 2010
* Trading the VIX to Hedge Stock Market Volatility - Monday, June 21, 2010
* What Traders Should Watch this Hurricane Season - Friday, June 04, 2010
* Lumber Loses its Luster, but Long-Term Looks Brighter - Thursday, May 27, 2010
* The Eurozone Bailout: Is it Enough? - Wednesday, May 12, 2010
About the authorAaron Fennell is a Senior Market Strategist and Chartered Financial Analyst based in Toronto with Lind-Waldock, a division of MF Global Canada Co. He employs a top-down approach to market analysis, working to understand the broad global macro trends, geopolitical developments and the supply and demand balance of various commodity groups. He believes investors must recognize that futures are complex and powerful tools that can be used to accomplish specific financial objectives, and Aaron works with each client to provide a complete understanding of these tools and how to use them efficiently.Aaron is accepting clients from Canada and can be reached at 877-840-5333 or via email at
afennell@lind-waldock.com.
MF Global Canada Co. is a member of the Investment Dealers Association of Canada and Canadian Investor Protection Fund. Visit Lind-Waldock in Canada at
http://www.lind-waldock.ca


