 Trade Results of M.A. Perry
 Trader and Founder of
WRB Analysis (wide range body/bar analysis)
TheStrategyLab Price Action Trading (no technical indicators)
Phone: +1 708 572-4885
wrbtrader (more info about me):
http://www.thestrategylab.com/wrbtrader.htmFree Chat Room: http://www.thestrategylab.com/tsl/forum/viewforum.php?f=164 Archive Real-Time Chat Logs (timestamp, entries/exits, position size):
http://www.thestrategylab.com/ftchat/forum/viewforum.php?f=20 Accolades (Testimonials): http://www.thestrategylab.com/Accolades.htm TheStrategyLab Reviews: http://www.thestrategylab.com/thestrategylab-reviews.htm Price Action Trading: http://www.thestrategylab.com/price-action-trading.htmTheStrategyLab Business Hours: 8am - 5pm est (Mon - Fri)
wrbanalysis@gmail.com (24/7)
Stocktwits @
http://stocktwits.com/wrbtrader (24/7)
Twitter @
http://twitter.com/wrbtrader (24/7)
Attachment:
 091517-wrbtrader-Price-Action-Trading-PnL-Blotter-Profit+437.50.png [ 96.14 KiB | Viewed 228 times ]
click on the above image to view today's performance verification Price Action Trade Performance for Today: Emini RTY ($RTY_F) futures @
$0.00 dollars or +0.00 points, Emini ES ($ES_F) futures @
$437.50 dollars or +8.75 points, Light Crude Oil CL ($CL_F) futures @
$0.00 dollars or +0.00 points, Gold GC ($GC_F) futures @
$0.00 dollars or +0.00 points and EuroFX 6E ($6E_F) futures @
$0.00 dollars or +0.0000 ticks.
Total Profit @ $437.50 dollars Disclaimer: Today's trading performance is not an indication of my future performance and not an indication of the future performance for any trader that decides to learn/apply WRB Analysis.Russell 2000 Emini RTY Futures: 1 tick or 0.10 = $5.00 dollars and there's more contract information @
CMEGroup (formerly as TF @
The ICE)
S&P 500 Emini ES Futures: 1 tick or 0.25 = $12.50 dollars and there's more contract information @
CMEGroup Light Crude Oil CL (WTI) Futures: 1 tick or 0.01 = $10.00 dollars and there's more contract information @
CMEGroup Gold GC Futures: 1 tick or 0.10 = $10.00 dollars and there's more contract information @
CMEGroupEuroFX 6E Futures: 1 tick or 0.0001 = $12.50 dollars and there's more contract information @
CMEGroup Today's Trade Log: All of my live trades are posted
real-time in the timestamp ##TheStrategyLab
free chat room via the user name
wrbtrader for anyone to do a real-time review. The live trade is posted 3.2 seconds on average after the trade confirmation via an auto script to minimize delays in posting of my trades. You can review
today's price action trade journal about my trades (e.g. time, price entry, contract size, price exit, market analysis) as the trade traversed to its completion. In addition, sometimes I'll post
real-time trading tips in the free ##TheStrategyLab chat room involving WRBs, WRB Hidden GAPs, Key Market Events (KME), Tutorial Chapters 2 & 3, WRB Zones, Reaction Highs/Lows, Contracting Volatility or Expanding Volatility even though the free chat room is not design to be an education chat room because the education is
only performed at the forums in the private threads. Its all
archived @ http://www.thestrategylab.com/ftchat/forum/viewtopic.php?f=171&t=2648  ##TheStrategyLab Chat Room
 is
free. The free chat room is
not a signal calling trading room. I do
not mentor (never have) although I get many requests to do mentoring. There is education but
only in members private threads at the forum involving members asking questions (help) about their own trading. Thus, the primary purpose of TheStrategyLab free chat room is for you to use as your
trade journal so that you can use as valuable feedback and for members to help each other...as in more eyes on the market. In addition, we
highly recommend that you use the free chat room with a professional trade journal software like tradebench.com, edgewonk.com, tradervue.com, tradingdiarypro.com, stocktickr.com, journalsqrd.com, tradingdiary.pro, mxprofit.com or trademetria.com because they can provide you with the
quantitative statistical analysis of your trading. You can then download your results and post them in your private thread at the forum. Also, you can use TheStrategyLab free chat room to ask real-time WRB Analysis questions. Yet, please do
not post your brokerage statements in the free chat room. Instead, its highly recommended that you only post your brokerage statements in your private thread for
security reasons. TheStrategyLab free chat room is on IRC via users request because the IRC servers are located in many different countries, software in many different languages, many different mobile apps and many different types of social media software can be used to log in. I'm the
moderator of the free chat room via the user name
wrbtrader. Thus, I
keep the peace between members without hesitation in removing trouble makers so that members can peacefully post their market observations, trades, WRB Analysis commentary about the markets without being trolled.
TheStrategyLab free chat room is
not for traders looking for someone to hold their hands and tell them when to buy or sell. TheStrategyLab is for you to post
your real-time analysis or trades so that you can
review as feedback for any trading day to provide valuable information about the results in
your broker statements. Access instructions for chat room @
http://www.thestrategylab.com/tsl/forum/viewforum.php?f=164Quote:
Also, posted below for you to
review are direct links to information about my
price action trade methodology and
trading plan (there's a difference between the two) that enables me to identify key trading areas in the price action that represent changes in supply/demand and volatility along with being able to exploit these changes via WRB Analysis (wide range body/bar analysis). I'm primarily a day trader because it suits my
personal lifestyle but I do occasionally swing trade and position trade. Simply, my trade method is applicable for position trading, swing trading and day trading.
Price Action Analysis via Advance WRB Analysis Tutorial Chapters @
http://www.thestrategylab.com/WRBAnalysisTutorials.htm and there's a
free study guide of the WRB Analysis Tutorial Chapters 1, 2 and 3 @
http://www.thestrategylab.com/tsl/forum/viewtopic.php?f=119&t=718 Analysis -----> Trade Signals Trade Signal Strategies via Volatility Trading Report (VTR) @
http://www.thestrategylab.com/VolatilityTrading.htm and there's a
free trade signal strategy @
http://www.thestrategylab.com/tsl/forum/viewforum.php?f=89 so that you can freely test drive one of our price action trade strategies with support (answering your questions)
prior to purchasing the Volatility Trading Report (VTR). All WRB Analysis Tutorial Chapters 1 - 12 are included in the purchase of the Volatility Trading Report (VTR).
Daily Trading Plan Routine @
http://www.thestrategylab.com/tsl/forum/viewtopic.php?f=327&t=3486 contains brief information about trading plan, market context, brokers, trading time frames, position size management and other discussions.
-----------------------------
Market Context Summaries The below summaries by
Bloomberg,
Briefing,
Reuters and
Yahoo! Finance helps me to do a quick review of the fundamentals,
FED/
ECB/
BOE/
IMF actions or any important global economic events (e.g.
Eurozone,
MarketWatch.com) that had an impact on today's price action in many trading instruments I monitor during the trading day. Simply, I'm a strong believer that key market events causes key changes in supply/demand and volatility resulting in
trade opportunities (swing points and strong continuation price actions) that reach profit targets. Thus, I pay attention to these key market events, intermarket analysis (e.g. Forex EurUsd, EuroFX 6E futures, Gold GC futures, Light Crude Oil (WTI) CL & Brent Oil futures, Eurex DAX futures, Euronext FTSE100 futures, Emini ES futures, Emini TF futures, Treasury ZB futures and U.S. Dollar Index futures) while using WRB Analysis from one trade to the next trade to give me the
market context for price action trading before the appearance of my
technical analysis trade signals. Therefore, I maintain these
archives for easy review to allow me to understand what was happening on any given trading day
in the past involving key market events to help better understand my trade decisions (day trading, swing trading, position trading)...something I can
not get from my broker PnL statements alone. Further, most financial websites remove (delete) their archives after a few years to make room for new content. Therefore, I maintain my own archives of the news content so that I have it available for me when financial websites no longer archives their content.
Attachment:
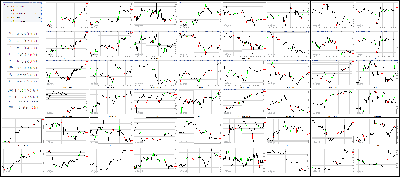 091517-Key-Price-Action-Markets.png [ 1.07 MiB | Viewed 274 times ]
click on the above image to view today's price action of key markets The Market at 04:30PM ET[BRIEFING.COM] Equities ticked up on Friday, capping off this week's run to record highs on a positive note. The Dow (+0.3%) advanced to a new-all time high once again, as did the S&P 500 (+0.2%), which settled right at the round mark of 2,500. The Nasdaq (+0.3%) also finished modestly higher, but didn't gain enough to erase its Thursday decline, leaving the index about 12 points below its record-high close. For the week, the S&P 500 added 1.6%.
On one hand, Friday's uptick was surprising considering that it came on the heels of yet another North Korean missile launch, which crossed over the northern Japanese island of Hokkaido. However, on the other hand, the market's response was entirely consistent with the recent past as investors have generally taken Pyongyang's missile tests in stride.
Eight of the eleven sectors advanced on Friday, with the lightly-weighted telecom services group (+1.8%) leading the charge by a wide margin, securing its spot at the top of the week's leaderboard (+3.9%). The financials (+0.5%) and energy (+0.2%) sectors also outperformed on Friday, finishing the week on telecom's heels with weekly gains of 3.3% and 3.5%, respectively.
The top-weighted technology sector (+0.3%) broke its two-day losing streak, thanks in large part to chipmakers, which sent the PHLX Semiconductor Index (+1.7%) higher for the fifth day in a row. NVIDIA (NVDA 180.11 +10.71) led the semiconductor rally, climbing 6.3% to a new all-time high, after its target price was raised to $250 from $180 at Evercore ISI on Friday morning.
Apple (AAPL 159.88, +1.60) also played a major role in the tech sector's positive Friday performance, snapping out of its recent funk, which started immediately following the company's annual product event on Tuesday. The tech titan climbed 1.0% to settle with a weekly gain of 0.8%.
On the flip side, Oracle (ORCL 48.74, -4.05) dropped 7.7%, giving back all of its September gain, after issuing cautious guidance that overshadowed its better-than-expected earnings and revenues.
The health care (-0.3%) and consumer discretionary (-0.2%) spaces were the weakest sectors on Friday, trimming their weekly gains to 0.4% and 0.9%, respectively. Meanwhile, the rate-sensitive utilities group (+0.1%) eked out a narrow victory, but its Friday performance was far from enough to prevent a last place finish in the weekly sector standings (-0.4%).
In the bond market, U.S. Treasuries didn't do much to relieve the huge weekly losses they carried into Friday's session. The yield on the benchmark 10-yr Treasury note finished flat at 2.20%, locking in a 14 basis point gain for the week. Meanwhile, the 2-yr yield climbed two basis points to 1.38%, extending its weekly gain to 13 basis points.
Reviewing Friday's big batch of economic data, which included August Retail Sales, August Industrial Production & Capacity Utilization, the preliminary reading of the University of Michigan Consumer Sentiment Index for September, the September Empire State Manufacturing Index, and July Business Inventories:
August retail sales decreased 0.2%, missing the Briefing.com consensus estimate, which called for an increase of 0.1%. The prior month's reading was revised to +0.3% from +0.6%. Excluding autos, retail sales increased 0.2% while the Briefing.com consensus expected an increase of 0.5%. The prior month's reading was revised to +0.4% from +0.5%.
The key takeaway from the report is that it will temper forecasts for Q3 consumer spending as core retail sales, which exclude auto, gasoline station, building equipment and materials, and food services and drinking places sales, declined 0.2%.
Industrial Production decreased 0.9% in August (Briefing.com consensus +0.2%) while Capacity Utilization declined to 76.1% (Briefing.com consensus 76.8%) from a revised reading of 76.9% in July (from 76.7%).
The key takeaway from the report is that industrial production, excluding the hurricane impact, was still weak in August.
The preliminary reading of the University of Michigan Consumer Sentiment Index for September declined to 95.3 (Briefing.com consensus 95.5) from 96.8 in August.
The key takeaway from the report is that consumers' assessment of their financial situation is the best it has been in more than a decade.
The Empire Manufacturing Survey for September declined to 24.4 from the prior month's reading of 25.2. The Briefing.com consensus estimate was pegged at 20.0.
Business Inventories rose 0.2% in July, which is in line with the Briefing.com consensus. The prior month's reading was left unrevised at +0.5%.
The key takeaway from the report is that pricing power will still be hard to come by given the elevated inventory-to-sales ratio, which held steady at 1.38 (down from 1.40 a year ago).
On Monday, investors will receive just one notable piece of economic data--the NAHB Housing Market Index for September--which will cross the wires at 10:00 ET.
Nasdaq Composite +19.8% YTD
Dow Jones Industrial Average +12.7% YTD
S&P 500 +11.7% YTD
Russell 2000 +5.5% YTD
Week In Review: Movin' On Up
Stocks rallied to new record highs this week--more than making up for last week's decline--following Hurricane Irma's weaker-than-expected Florida landfall and ahead of next week's FOMC meeting. The Dow led this week's advance, climbing 2.2%, followed by the S&P 500 (+1.6%), and then the Nasdaq (+1.4%). For the year, the S&P 500 now holds a gain of 11.7%.
The bulk of this week's gain came right off the bat as investors happily dialed back their estimates on Monday for damages related to Hurricane Irma, which quickly petered out after hitting the Florida Keys on Sunday. Insurers like Travelers (TRV) led the Monday rally, underpinned by the prospect of fewer-than-expected hurricane related claims, but much of their gains were unwound by the end of the week.
Equities followed up their stellar Monday performance with another win on Tuesday, but conviction was much more modest. Apple (AAPL) held its annual product event, in which the company unveiled a trio of iPhones, including the iPhone 8, the iPhone 8 Plus, and the high-end iPhone X--which CEO Tim Cook called "the biggest leap forward since the original iPhone."
On the whole, Tuesday's product event provided little new information as many of the details had been leaked beforehand. Apple sold off immediately following the event, with some investors citing concerns related to the iPhone X's later-than-expected release date (November 3). However, the tech giant bounced back on Friday, extending its massive year-to-date gain to 38.0%.
Following Tuesday's modest victory--which sent all three major U.S. indices to new record highs--the stock market took a breather, ending the week in a sideways trend. The Nasdaq ticked lower in the latter half of the week, settling just a step below its record high, while the S&P 500 and the Dow ticked up, further extending their record marks.
Investors largely ignored North Korea's latest missile launch, which flew over northern Japan on Friday morning, continuing the week's safe-haven sell off. After hitting a 10-month low last week, the yield on the benchmark 10-yr Treasury note climbed 14 basis points this week, settling at 2.20%. Meanwhile, the 2-yr yield climbed 13 basis points to finish at 1.38%.
A hotter-than-expected August CPI reading (+0.4% actual vs +0.3% Briefing.com consensus), which showed a year-over-year increase of 1.9%, prompted an adjustment in rate-hike expectations. According to the CME FedWatch Tool, investors currently place the chances of a December rate hike at 57.8%, up from last week's 31.0%.
However, the Fed's massive balance sheet will be the focus of next week's FOMC meeting as it is widely expected that Fed Chair Janet Yellen will announce the start of a gradual reduction of assets bought in response to the 2008 financial crisis. The two-day FOMC meeting will kick off on Tuesday.
Dow: +64.86… | Nasdaq: +19.38… | S&P: +4.61…
NASDAQ Adv/Dec 1411/1114. …NYSE Adv/Dec 1851/1057.
Price Action Trading
@ http://www.thestrategylab.com/price-action-trading.htm Trade Strategies via Volatility Analysis
@ http://www.thestrategylab.com/VolatilityTrading.htm Review of TheStrategyLab
@ http://www.thestrategylab.com/tsl/forum/viewtopic.php?f=84&t=3167 TheStrategyLab Review
@ http://www.thestrategylab.com/thestrategylab-reviews.htmSpecial thanks to Bloomberg, Briefing, Reuters and Yahoo! Finance for their market summaries. Also, thank you for the review of TheStrategyLab performance record...hopefully the links will be useful for you. 
Best Regards,
M.A. Perry
Online user name
wrbtrader (more info about me):
http://www.thestrategylab.com/wrbtrader.htmTheStrategyLab Price Action Trading
Trader and Founder of
WRB Analysis (wide range body/bar analysis)
 @ http://twitter.com/wrbtrader
  @ http://stocktwits.com/wrbtraderhttp://www.thestrategylab.com
 Phone: +1 708 572-4885
TheStrategyLab Business Hours: 8am - 5pm est (Mon - Fri)
Skype Messenger: kebec2002
wrbanalysis@gmail.com