 Trade Results of M.A. Perry
 Trader and Founder of
WRB Analysis (wide range body/bar analysis)
Price Action Trading (no technical indicators)
Phone: +1 708 572-4885
Free Chat Room:
http://www.thestrategylab.com/tsl/forum/viewforum.php?f=164Business Hours: 8am - 5pm est (Mon - Fri)
questions@thestrategylab.com (24/7)
http://twitter.com/wrbtrader (24/7)
Attachment:
 123114-wrbtrader-Price-Action-Trading-PnL-Blotter-Profit+7767.50.png [ 178.32 KiB | Viewed 787 times ]
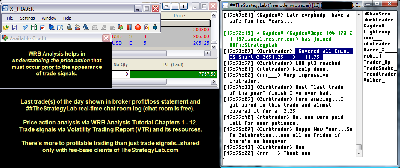
click on the above image to view today's performance verification Price Action Trade Performance for Today: Emini TF ($TF_F) futures @
$80.00 dollars or +0.80 points, Emini ES ($ES_F) futures @
$7,687.50 dollars or +153.75 points, Light Crude Oil CL ($CL_F) futures @
$0.00 dollars or +0.00 points, Gold GC ($GC_F) futures @
$0.00 dollars or +0.00 points and EuroFX 6E ($6E_F) futures @
$0.00 dollars or +0.0000 ticks.
Total Profit @ $7,767.50 dollarsRussell 2000 Emini TF Futures: 1 tick or 0.10 = $10.00 dollars and there's more contract information @
The ICE S&P 500 Emini ES Futures: 1 tick or 0.25 = $12.50 dollars and there's more contract information @
CMEGroup Light Crude Oil CL (WTI) Futures: 1 tick or 0.01 = $10.00 dollars and there's more contract information @
CMEGroup Gold GC Futures: 1 tick or 0.10 = $10.00 dollars and there's more contract information @
CMEGroupEuroFX 6E Futures: 1 tick or 0.0001 = $12.50 dollars and there's more contract information @
CMEGroup Trade Log: All of my trades were posted real-time in the timestamp ##TheStrategyLab chat room. You can read
today's price action trading information about my trades (e.g. time, price entry, contract size, price exit) as the trade traversed to its completion. Also, sometimes I'll post
real-time trading tips in ##TheStrategyLab chat room involving WRBs, WRB Hidden GAPs, Key Market Events (KME), Tutorial Chapters 2 & 3, WRB Zones, Reaction Highs/Lows, Contracting Volatility or Expanding Volatility. Its all
archived @ http://www.thestrategylab.com/ftchat/forum/viewtopic.php?f=137&t=1972 Quote:
Also, posted below are direct links to information about my
price action trade methodology and
trading plan (there's a difference between the two) that enables me to identify key trading areas in the price action that represent changes in supply/demand and volatility along with being able to exploit these changes via WRB Analysis (wide range body/bar analysis). I'm primarily a day trader because it suits my
personal lifestyle but I do occasionally swing trade and position trade. Simply, my trade method is applicable for position trading, swing trading and day trading.
 ##TheStrategyLab Chat Room
 is
free. Members and I use the chat room to post WRB Analysis commentary, real-time trades and to post anything else related to trading. The chat room helps me tremendously in my own trading because I use it to document (journal) general volatility analysis involving WRB Analysis so that I can easily review at a later date my thoughts as I interacted with the markets...info I can not get from my broker statements. Also, this is
not a signal calling chat room where a head trader tells
you when to buy or sell and I do not have the time/energy/resources to manage a signal calling chat room. Access instructions for chat room @
http://www.thestrategylab.com/tsl/forum/viewforum.php?f=164 Price Action Analysis via Advance WRB Analysis Tutorial Chapters @
http://www.thestrategylab.com/WRBAnalysisTutorials.htm and there's a
free study guide of the WRB Analysis Tutorial Chapters 1, 2 and 3 @
http://www.thestrategylab.com/tsl/forum/viewtopic.php?f=119&t=718 Analysis -----> Trade Signals Trade Signal Strategies via Volatility Trading Report (VTR) @
http://www.thestrategylab.com/VolatilityTrading.htm and there's a
free trade signal strategy @
http://www.thestrategylab.com/tsl/forum/viewforum.php?f=89 so that you can freely test drive one of our price action trade strategies with support (answering your questions)
prior to purchasing the Volatility Trading Report (VTR).
All WRB Analysis Tutorial Chapters 1 - 12 are included in the purchase of the Volatility Trading Report (VTR).
Trading Plan Daily Routine @
http://www.thestrategylab.com/tsl/forum/viewtopic.php?f=252&t=2585 -----------------------------
Market Context Summaries The below summaries by
Bloomberg,
CNNMoney,
Reuters and
Yahoo! Finance helps me to do a quick review of the fundamentals,
FED/
ECB/
BOE/
IMF actions or any important global economic events (e.g.
Eurozone,
MarketWatch.com) that had an impact on today's price action in many trading instruments I monitor during the trading day. Simply, I'm a strong believer that key market events causes key changes in supply/demand and volatility resulting in
trade opportunities (swing points and strong continuation price actions) that reach profit targets. Thus, I pay attention to these key market events, intermarket analysis (e.g. Forex EurUsd, EuroFX 6E futures, Gold GC futures, Light Crude Oil (WTI) CL & Brent Oil futures, Eurex DAX futures, Euronext FTSE100 futures, Emini ES futures, Emini TF futures, Treasury ZB futures and U.S. Dollar Index futures) while using WRB Analysis from one trade to the next trade to give me the
market context for price action trading before the appearance of my
technical analysis trade signals. Therefore, I maintain these
archives to allow me to understand what was happening on any given trading day
in the past involving key market events to help better understand my trade decisions (day trading, swing trading, position trading)...something I can
not get from my broker statements alone. Further, most financial websites remove (delete) their archives after a few years to make room for new content. Therefore, I maintain my own archives of the news content so that I have it available for me when financial websites no longer archives their content.
Attachment:
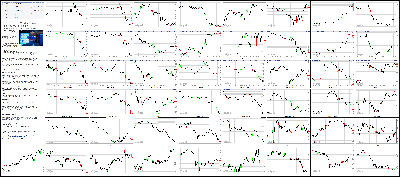 123114-Key-Price-Action-Markets.png [ 1.4 MiB | Viewed 839 times ]
click on the above image to view today's price action of key markets 4:10 pm: [BRIEFING.COM] The stock market ended the last session of 2014 on a lower note. The S&P 500 lost 1.0%, but that did not stop the benchmark index from gaining 11.4% over the course of 2014. Meanwhile, the tech-heavy Nasdaq ended the session (-0.9%) and the year (+13.4%) ahead of the S&P 500.
Before we delve into the details of today's trading day, it is important to note that trading volume at the NYSE was among the lowest of the year (650 million), suggesting few carbon-based life forms took part in the final affair of the year.
All ten sectors settled in the red with utilities (-1.9%) ending at the bottom of the leaderboard. In all likelihood, today's selling was a function of profit taking after the countercyclical sector led the 2014 market rally with a gain of 24.3%.
The remaining groups did not fare much better. The top-weighted technology sector (-1.2%) was among the early leaders, but began fading from its high not long before noon ET, dragging the broader market down with it. Apple (AAPL 110.38, -2.14) began the day with a slim gain, but found itself in the red within the first 45 minutes of the session. The largest sector component continued retreating throughout the day while other large cap tech names followed suit. Shares of Apple fell 1.9% today, but still soared nearly 38.0% in 2014. Chipmakers, meanwhile, outperformed with the PHLX Semiconductor Index losing 0.6%.
The outperformance of chipmakers helped the Nasdaq exhibit some relative strength, but the index also received a helping hand from biotechnology. The iShares Nasdaq Biotechnology ETF (IBB 303.35, -1.27) shed 0.4% while the health care sector (-1.0%) could not stay out of the red, narrowing its 2014 advance to 23.3%.
Elsewhere among cyclical groups, financials (-1.2%) lagged while the energy sector lost 0.8% to widen its 2014 decline to 10.0% amid another volatile day in oil trading pits. WTI crude dipped below the $52.60/bbl mark ahead of the close, but rocketed back to its session high to end the day lower by 1.0% at $53.49/bbl.
Also of note, the consumer discretionary sector (-0.4%) ended ahead of other groups. Homebuilders and retailers were responsible for the outperformance as iShares Dow Jones US Home Construction (ITB 25.88, +0.20) gained 0.8% while SPDR S&P Retail ETF (XRT 96.01, -0.28) slipped 0.3%.
Treasuries capped a strong year with another rally. As a result, the benchmark 10-yr yield fell two basis points to 2.17%, finishing 87 basis points below its close from December 31, 2014. On a somewhat related note, the Dollar Index (90.27, +0.28) climbed 0.3% to end the year at its best level since early 2006.
Economic data included Initial Claims, Chicago PMI, and Pending Home Sales:
The initial claims level increased to 298,000 for the week ending December 27 from an upwardly revised 281,000 (from 280,000) while the Brieifng.com consensus expected an increase to 290,000
The Department of Labor reported that there were no special factors driving the increase in unemployment insurance filings; however, it is possible that the Christmas holiday played at least a small part in the increase
The continuing claims level fell to 2.353 million from an upwardly revised 2.406 million (from 2.403 million) while the consensus expected a decline to 2.375 million
After four consecutive months above 60, the Chicago PMI fell from 60.8 in November to 58.3 in December while the Briefing.com consensus expected a decline to 60.0
Pending home sales for November rose 0.8%, which was in-line with the Briefing.com consensus
Friday's data will be limited to the ISM Index for December (Briefing.com consensus 57.5) and the November Construction Spending report (consensus 0.1%). Both reports will be released at 10:00 ET.
Nasdaq Composite +13.4% YTD
S&P 500 +11.4% YTD
Dow Jones Industrial Average +7.5% YTD
Russell 2000 +3.6% YTD
3:25 pm: [BRIEFING.COM] Gold and silver prices extended losses into the close today, finishing today's pit trading session near today's low.
Feb gold ended today's session $17.10 lower at $1183.30/oz, while Mar silver dropped 4.1% (or $0.67) to $15.59/oz. Mar copper lost 3 cents to end at $2.82/lb.
Energy futures remained weak today as well, as oil and natural gas went on to extend losses in afternoon trading. However, in the last 10 minutes of pit trading, Feb crude rallied $1.05/barrel to end the session at $53.49/barrel. In electronic trade, Feb crude was down 1%.
2:55 pm: [BRIEFING.COM] The S&P 500 (-0.6%) has continued inching lower with the final session of the year entering its last hour.
Eight of ten sectors are on course to finish the year with gains ranging from 5.1% (materials) and 24.8% (utilities). Outside of utilities, the health care sector (+24.0%) represents the only group that has spiked more than 20.0% in 2014.
Elsewhere, the top-weighted technology sector has surged 18.7% in 2014 while energy and telecom services will end the year in the red. The energy sector has given up 9.5% this year while the telecom space has surrendered 1.6%.
2:30 pm: [BRIEFING.COM] Equity indices have extended their losses with the S&P 500 now down 0.5%. Only the consumer discretionary sector continues hovering just north of its flat line while the other nine groups are now in the red.
The retreat in equities has been accompanied by another leg down in crude oil. The energy component is lower by 2.5% at $52.78/bbl, but the energy sector (-0.3%) has climbed ahead of the broader market.
Elsewhere, the Treasury market ended 2014 with gains. The 10-yr yield slipped two basis points to 2.17%, representing an 87-basis point decline for the year.
2:00 pm: [BRIEFING.COM] The S&P 500 remains near its session low.
The DOL reported that there weren't any special factors driving the increase in unemployment insurance filings. It is possible, however, that the Christmas holiday played at least a small part in the increase.
After four consecutive months above 60, the Chicago PMI fell from 60.8 in November to 58.3 in December.
A reading above 60.0 is not sustainable in the long term. The drop to 58.3 does not signal a major shift in manufacturing conditions in the Chicago region.
1:30 pm: [BRIEFING.COM] The major U.S. indices remain near their sessions lows with the S&P 500 down 0.2%.
Despite today's dip, the U.S. stock market is set to close the year with another big gain. Not all stocks went along for the ride though. IBM (IBM 161.29, +1.24), which is down 14% for the year, is set the be the worst-performing Dow component for the second consecutive year.
A notable attribute during today's session lies in the gains seen in the Volatility Index (VIX 17.33, +1.41). The VIX, generally identified as the fear index, has sported strong gains all day, even earlier when the U.S. indices were sporting gains across the board.
Utilities (-0.75%) and Telecom (-0.8%) continue to be the worst-performing S&P sectors today.
12:55 pm: [BRIEFING.COM] The major averages trade little changed at midday after slipping from their highs in recent action. The Russell 2000 outperforms with a gain of 0.4% while the S&P 500 (-0.3%) sits just above its low.
Equities began the final session of the year with modest gains that were paced by two heavily-weighted sectors. The two groups-consumer discretionary (+0.3%) and health care (+0.2%)-remain in the green at this juncture, but the rest of the market has turned negative.
Most notably, the energy sector (-0.6%) has lagged since the start with crude oil weighing down the growth-sensitive group. Currently, the energy component is lower by 2.4% at $52.82/bbl while the energy sector is on course to end 2014 lower by 9.8%.
Elsewhere, the top-weighted technology sector (-0.3%) has led the market into negative territory during the past hour. Shares of Apple (AAPL 111.46, -1.06) have extended their decline to 0.9% while other influential sector members like Google (GOOGL 534.28, -1.00), Microsoft (MSFT 46.87, -0.15), and Intel (INTC 36.69, -0.07) also hover in the red. Intel has given up 0.2%, but other chipmakers have fared better with the PHLX Semiconductor Index up 0.3%.
Chipmakers have helped the Nasdaq (unch) stay ahead of the broader market and the tech-heavy index has also drawn support from biotechnology. The iShares Nasdaq Biotechnology ETF (IBB 307.74, +3.12) trades higher by 1.1%.
All in all, it is worth noting that today's participation has been very limited with just a shade over 200 million shares having changed hands at the NYSE floor.
Treasuries trade in the green with the 10-yr yield down two basis points at 2.17%.
Economic data included Initial Claims, Chicago PMI, and Pending Home Sales:
The initial claims level increased to 298,000 for the week ending December 27 from an upwardly revised 281,000 (from 280,000) while the Brieifng.com consensus expected an increase to 290,000
The Department of Labor reported that there were no special factors driving the increase in unemployment insurance filings; however, it is possible that the Christmas holiday played at least a small part in the increase
The continuing claims level fell to 2.353 million from an upwardly revised 2.406 million (from 2.403 million) while the consensus expected a decline to 2.375 million
After four consecutive months above 60, the Chicago PMI fell from 60.8 in November to 58.3 in December while the Briefing.com consensus expected a decline to 60.0
Pending home sales for November rose 0.8%, which was in-line with the Briefing.com consensus
12:30 pm: [BRIEFING.COM] Recent action saw the S&P 500 (-0.3%) slump to a fresh low. The move was not brought on by any particular news catalyst, but it is worth mentioning that today's trading conditions have been very thin with just 191 million shares having changed hands at the NYSE so far.
In our previous update, we highlighted the outperforming technology sector, but the group is now lower by 0.4% after leading the recent downtick. Most top-weighted sector components are now in the red with Apple (AAPL 111.25, -1.27) trading lower by 1.1%. Chipmakers, meanwhile, continue showing relative strength. The PHLX Semiconductor Index is higher by 0.1%.
On the upside, consumer discretionary (+0.3%) and health care (+0.2%) are the only remaining advancers.
12:00 pm: [BRIEFING.COM] Not much change in the major averages with the S&P 500 (+0.1%) trading in the middle of today's five-point range. Five sectors hover in the red while the other five hold gains. However, of the five advancers, only consumer discretionary (+0.7%) and health care (+0.5%) trade with gains larger than 0.2%.
Elsewhere, the top-weighted technology sector (+0.2%) has received support from some of its largest components like IBM (IBM 161.27, +1.22) and Microsoft (MSFT 47.25, +0.23). Chipmakers have also displayed relative strength with the PHLX Semiconductor Index trading higher by 0.7%. The strength in these areas helps explain the continued outperformance of the Nasdaq Composite (+0.4%).
11:25 am: [BRIEFING.COM] The major averages remain near their recent levels with the S&P 500 trading higher by 0.2%. Although equities have not moved much this morning, the Dollar Index (90.25, +0.26) has extended to a fresh high thanks to weakness in the euro and yen. The euro is now down about 60 pips, trading just north of the 1.2100 level. The single currency has now dropped below yesterday's low, marking a fresh low for 2014.
Elsewhere, Treasuries continue holding slim gains with the 10-yr yield down a basis point at 2.18%.
10:55 am: [BRIEFING.COM] Equity indices have built on their opening gains with the Russell 2000 (+0.8%) in the lead. Meanwhile, the Nasdaq Composite (+0.6%) and S&P 500 (+0.3%) follow a bit behind.
The S&P 500 remains pressured by the energy sector (-0.9%) while other groups trade closer to their flat lines. Most notably, consumer discretionary (+0.7%) and health care (+0.8%) have helped the index climb to a new session high.
The health care sector has rallied behind biotechnology as evidenced by a 1.4% gain in the iShares Nasdaq Biotechnology ETF (IBB 309.23, +4.61). The ETF is now higher by 0.8% for the week and up more than 36.0% since the end of 2013. As for the health care sector, the top-weighted defensive group has spiked 25.5% this year.
10:40 am: [BRIEFING.COM]
Oil prices start the morning off lower, with Brent and WTI oil sharply lower, which left a Brent/WTI spread of around $3/barrel.
WTI crude oil fell as low as $52.51/barrel this morning and initially spiked higher to around $53.71/barrel following the weekly EIA inventory data
Feb crude oil is now -1.8% at $53.14/barrel
Natural gas futures are weak as well, but have been coming back a little
The Feb contract fell as low as $2.99/MMBtu and is currently -2.8% at $3.01/MMBtu.
The dollar index has been climbing higher this morning, which has added pressure on commodities overall, especially precious metals.
Feb gold futures just hit a new LoD in recent trade and is currently -0.7% at $1191.60/oz. Mar silver is underperforming by far, now -2.8% at $15.82/oz
10:00 am: [BRIEFING.COM] The major averages continue holding slim gains with the S&P 500 higher by 0.1%.
Pending home sales for November rose 0.8%, which was in-line with the Briefing.com consensus.
9:45 am: [BRIEFING.COM] As expected, the major averages opened the session with modest gains. The S&P 500 trades higher by 0.1% with six sectors showing early gains.
Heavily-weighted consumer discretionary (+0.6%) and health care (+0.6%) have provided some early support while the energy sector (-1.2%) is the weakest performer amid selling in crude oil. The energy component has given up 2.7% and currently trades at $52.66/bbl.
Treasuries continue holding slim gains with the 10-yr yield hovering at 2.18%.
Just released, the Chicago PMI for December fell to 58.3 from 60.8, while the Briefing.com consensus expected a decrease to 60.0.
9:12 am: [BRIEFING.COM] S&P futures vs fair value: +3.30. Nasdaq futures vs fair value: +6.20. The stock market is on track to begin the final session of 2014 on a modestly higher note. The S&P 500 futures hover three points above fair value after respecting a narrow range throughout the night.
"Range-bound" is likely to remain the theme today with many participants staying away from the market. To that point, equity markets across Europe are now closed after registering slim gains in an abbreviated session.
Yesterday's session took place with just 525.7 million shares changing hands at the NYSE. That was a far cry from the 50-day average of 791 million, but was actually ahead of late August totals when volume ranged between 479 million and 509 million. For the time being, last Friday's 435.8 million represents the lowest total of the year.
Economic data released this morning was limited to the latest weekly initial jobless claims count, which totaled 298,000 while the Briefing.com consensus expected a reading of 290,000. Today's tally was above the revised prior week count of 281,000 (from 280,000). As for continuing claims, they fell to 2.353 million from 2.406 million.
More data remains with the Chicago PMI report for December (consensus 60.0) set to cross the wires at 9:45 ET while the Pending Home Sales report for November (expected 0.8%) will be released at 10:00 ET.
Treasuries hold slim gains with the 10-yr yield lower by a basis point at 2.18%.
8:54 am: [BRIEFING.COM] S&P futures vs fair value: +3.40. Nasdaq futures vs fair value: +5.70. The S&P 500 futures trade three points above fair value.
Asian markets ended 2014 on a higher note amid light volume. The final December reading of China's HSBC Manufacturing PMI marked the first contraction in seven months. According to HSBC, stronger disinflationary pressures call for additional easing from the People's Bank of China.
In economic data:
China's HSBC Manufacturing PMI ticked up to 49.6 from 49.5 (expected 49.5)
South Korea's CPI was flat month-over-month (expected -0.1%; previous -0.2%) while the year-over-year reading increased 0.8%, as expected (last 1.0%)
Australia's Housing Credit rose 0.6% (previous 0.6%) while Private Sector Credit increased 0.5%, as expected (prior 0.6%)
------
Japan's Nikkei was closed
Hong Kong's Hang Seng added 0.4% to end the year just below its early December high. Financials outperformed with Bank of China and Industrial & Commercial Bank of China both adding near 1.9%. Tencent Holdings lagged, falling 0.7%.
China's Shanghai Composite spiked 2.2%, finishing at its best level of 2014. Real estate names led with Gemdale and Beijing Capital Development spiking the limit, 10.0%.
India's Sensex rose 0.4%, but ended the year a bit below its December high. The advance was supported by most components with Bharat Heavy Electric and Dr Reddy's Laboratories setting the pace. The two gained 2.7% and 2.0%, respectively. Automakers lagged with Bajaj Auto, Mahindra & Mahindra, and Maruti Suzuki falling between 0.5% and 1.9%.
Major European indices ended the abbreviated session with modest gains while markets in Germany and Italy never bothered to open. Of note, Greek President Karolos Papoulias has dissolved parliament, setting the course for elections on January 25.
France's CAC added 0.6% with consumer names in the lead. Accor, Carrefour, Essilor International, and Pernod Ricard gained between 0.8% and 2.1%. Cap Gemini was the weakest performer, down 0.4%.
UK's FTSE rose 0.3%. Homebuilder Taylor Wimpey led with a gain of 2.7%. Energy and miners lagged with Antofagasta and Tullow Oil falling 0.3% and 0.4%, respectively.
Spain's IBEX settled just above its flat line. Acciona and Telefonica ended among the leaders with respective gains of 0.4% and 0.3%.
8:31 am: [BRIEFING.COM] S&P futures vs fair value: +3.50. Nasdaq futures vs fair value: +5.20. The S&P 500 futures trade four points above fair value.
The latest weekly initial jobless claims count totaled 298,000 while the Briefing.com consensus expected a reading of 290,000. Today's tally was above the revised prior week count of 281,000 (from 280,000). As for continuing claims, they fell to 2.353 million from 2.406 million.
7:57 am: [BRIEFING.COM] S&P futures vs fair value: +3.60. Nasdaq futures vs fair value: +6.50. U.S. equity futures trade modestly higher amid subdued action overseas. The S&P 500 futures trade four points above fair value after maintaining a three-point range throughout the night.
Today is setting up to be very quiet with many participants remaining away from their trading desks as the holiday week winds to a close. A handful of markets across Asia were closed altogether, which was also the case with Germany's DAX and Italy's MIB. Meanwhile, the remaining markets in Europe will close early.
Treasuries hold modest gains with the 10-yr yield down two basis points at 2.17%.
Weekly Initial Claims will be reported at 8:30 ET (Briefing.com consensus 290K), the Chicago PMI report for December (consensus 60.0) will cross the wires at 9:45 ET, and the Pending Home Sales report for November (expected 0.8%) will be released at 10:00 ET.
There are no notable movers in pre-market action at this time.
Reviewing overnight developments:
Asian markets ended higher. Hong Kong's Hang Seng +0.4% and China's Shanghai Composite +2.2% while Japan's Nikkei was closed.
In economic data:
China's HSBC Manufacturing PMI ticked up to 49.6 from 49.5 (expected 49.5)
South Korea's CPI was flat month-over-month (expected -0.1%; previous -0.2%) while the year-over-year reading increased 0.8%, as expected (last 1.0%)
Australia's Housing Credit rose 0.6% (previous 0.6%) while Private Sector Credit increased 0.5%, as expected (prior 0.6%)
In news:
The final December reading of China's HSBC Manufacturing PMI marked the first contraction in seven months. According to HSBC, stronger disinflationary pressures call for additional easing from the People's Bank of China.
Major European indices trade in the green. UK's FTSE +0.4%, France's CAC +0.4%, and Spain's IBEX is flat. Elsewhere, Germany's DAX and Italy's MIB are closed.
Investors did not receive any data of note
Among news of note:
Greek President Karolos Papoulias has dissolved parliament, setting the course for elections on January 25
6:50 am: [BRIEFING.COM] S&P futures vs fair value: +3.60. Nasdaq futures vs fair value: +4.80.
6:50 am: [BRIEFING.COM] Nikkei...Holiday......... Hang Seng...23605.04...+103.90...+0.40%.
6:50 am: [BRIEFING.COM] FTSE...6558.37...+11.40...+0.20%. DAX...Holiday.........
Special thanks to Bloomberg, CNNMoney, Reuters and Yahoo! Finance for their market summaries. 
Best Regards,
M.A. Perry
Trader and Founder of
WRB Analysis (wide range body/bar analysis)
 @ http://twitter.com/wrbtrader
  @ http://stocktwits.com/wrbtraderhttp://www.thestrategylab.com
 Phone: +1 708 572-4885
Business Hours: 8am - 5pm est (Mon - Fri)
Skype Messenger: kebec2002
questions@thestrategylab.com Go Back To TheStrategyLab.com Homepage


