 Trade Results of M.A. Perry
 Trader and Founder of
WRB Analysis (wide range body/bar analysis)
Price Action Trading (no technical indicators)
Attachment:
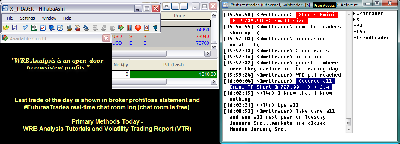 123011-wrbtrader-PnL-Blotter-Profit-1310.png [ 74.05 KiB | Viewed 811 times ]
click on the above image to view today's performance verification Trade Performance for Today: +13.10 points or
$1310 dollars in the Russell 2000 Emini TF ($TF_F) Futures.
Russell 2000 Emini TF Futures - 1 tick or 0.10 = $10.00 dollars and there's more contract information @
The ICE.
S&P 500 Emini ES Futures - 1 tick or 0.25 = $12.50 dollars and there's more contract information @
CMEGroup.
In addition, all trades were posted real-time in the
free #FuturesTrades chat room. Today's
#FuturesTrades trading chat room logs provides details (e.g. time, price, contract size) about each one of my trades from entry to exit along with price action commentary as the trade traversed...all archived
@ http://www.thestrategylab.com/ftchat/forum/viewtopic.php?f=98&t=1102.
To join our
free chat room...
registration instructions located at a different forum
@ http://www.thestrategylab.com/ftchat/forum/viewtopic.php?f=5&t=630Also, posted below are direct links to information about my
trade methodology and
trading plan (there's a difference between the two) that enables me to identify key trading areas in the price action that represent changes in supply/demand and volatility along with being able to exploit these changes via WRB Analysis (wide range body/bar analysis).
 WRB Analysis Tutorials
 @
http://www.thestrategylab.com/WRBAnalysisTutorials.htm and there's a
free study guide of the WRB Analysis Tutorial Chapters 1, 2 and 3 @
http://www.thestrategylab.com/tsl/forum/viewtopic.php?f=119&t=718.
Volatility Trading Report (VTR) @
http://www.thestrategylab.com/VolatilityTrading.htm and there's a
free trade signal strategy @
http://www.thestrategylab.com/tsl/forum/viewforum.php?f=89 so that you can freely test drive one of our trade strategies with support
prior to purchasing the Volatility Trading Report (VTR).
Trading Plan Daily Routine @
http://www.thestrategylab.com/tsl/forum/viewtopic.php?f=146&t=1312 -----------------------------
Market Summaries The below summaries by
Bloomberg,
CNNMoney and
Yahoo! Finance helps me to do a quick review of the fundamentals, FED/ECB/IMF actions or any important global economic events that had an impact on today's price action. Simply, I'm a strong believer that many variables (key market events) causes key changes in supply/demand and volatility that results in swing points and strong continuation price actions. Thus, I pay attention to these key market events from one trade to the next trade to give me the
market context for my
technical analysis. Just as important, these summaries becomes my
archives to allow me to understand what was happening on any given trading day in the past...something I can not get from my broker statements alone.
U.S. Stocks Declined, S&P 500 Index Unchanged For The Year Dec. 30 (Bloomberg) -- Bloomberg's Deborah Kostroun reports on the performance of the U.S. equity market today. U.S. stocks fell, leaving the Standard & Poor's 500 Index virtually unchanged for the year, as concern over Europe's debt crisis overshadowed optimism that the American economy will expand in 2012.
Stocks Finish Rocky Year Like It Never Happened Attachment:
 123011-Key-Price-Action-Markets.png [ 525.03 KiB | Viewed 752 times ]
click on the above image to view today's price action of key markets NEW YORK (CNNMoney) -- From up 8% to down 12%, stocks finished 2011 with an annual change of 0.003%...about as flat as you can get.
The S&P 500 index finished 2011 less than a point away from where it ended 2010 -- 0.04 points down to be exact. That's the smallest annual change in history.
Attachment:
![chart-sp500-2011-2.top[1].gif](./download/file.php?id=1659&t=1&sid=fb79d661605773ad3f51025c5123298b) chart-sp500-2011-2.top[1].gif [ 24.05 KiB | Viewed 751 times ]
chart-sp500-2011-2.top[1].gif [ 24.05 KiB | Viewed 751 times ]
At its peak in April, the S&P had climbed more than 8%. But by October, at the lowest levels of the year, it was down more than 12%.
The Dow, meanwhile, rose 5.5% for the year, and the Nasdaq lost 1.8%.
The mixed finish marks the end of a two-year winning streak for stocks.
Investors are happy to put 2011 to bed. From unrest in the Middle East and Japan's devastating earthquake to Europe's worsening debt crisis to the ongoing bickering in Washington, stocks experienced some violent swings.
So it's little wonder that investors are thankful for a quiet end to the year. Stocks finished little changed Friday. The Dow Jones industrial average (INDU) fell 69 points, or 0.6%. The S&P 500 (SPX) dropped 5 points, or 0.4%, and the Nasdaq (COMP) fell 9 points, or 0.3%.
Despite the dull finish, the U.S. stock market's performance could have been a lot worse, if you consider the performance of global markets.
In Europe, Britain's FTSE 100 (UKX) lost 5.6% in 2011, while Germany's DAX (DAX) and France's CAC 40 (CAC40) dropped more than 15%.
In Asia, the Nikkei (N225) tumbled 17%, while the Shanghai Composite (SHCOMP) and Hang Seng (HSI) sank more than 20%.
* Dow's biggest winner: Think burgers and friesThe main reason the Dow fared better than the S&P is because financial stocks, which had a dismal year, carry less weight in the blue chip index than they do in the S&P 500.
The Dow is a price-weighted index, so the most influential companies are those with the highest share price.
For example, IBM's (IBM, Fortune 500) stock is priciest at around $185 per share, and it has an 11.5% weight in the Dow. IBM's 25% rise accounted for about 300 of the Dow's nearly 700 point gain in 2011, according to Paul Hickey, co-founder of Bespoke Investment group.
The stocks in the S&P 500, on the other hand, are weighted according to the market value, making IBM's weighting there less than 2%.
Because of the different weightings, financial stocks make up just 7% of the Dow, while they represent 14% of the S&P 500.
* Merger 2012: The year of the hostile takeoverWhile stocks had lackluster year, Treasuries managed to log the best gains since 2008, according to the Bank of America Merrill Lynch U.S. Treasury Master index, which returned almost 10% this year.
In Friday trading, yields on the benchmark 10-year note 1.87% from 1.90% late Thursday.
Economy: A reading on December data showed Chinese manufacturing continued to slow. HSBC's final reading of its China purchasing managers index saw a 1-point increase to 48.7, but that figure remains below to 50 threshold for expansion of the sector.
Companies: Shares of American Airlines parent AMR Corp. (AMR, Fortune 500) plunged 32% Friday, following news that the company was being delisted from the NYSE as of Jan. 5.
The delisting is occurring because AMR's share price failed to average $1 over the past 30 days -- the minimum requirement set by the NYSE for listed stocks.
Shares of Yahoo (YHOO, Fortune 500) finished unchanged Friday, a day after spiking more than 2% following reports that China's Alibaba Group had hired a lobbying firm to prepare a bid for the U.S. web search pioneer.
World markets: Overseas stock markets closed a difficult year on a slightly positive note Friday.
* World markets end tough year on high noteIn Europe, Britain's FTSE 100 (UKX) finished up 0.1%, Germany's DAX (DAX) edged up 0.9% and France's CAC 40 (CAC40) rose 0.4%. But for the year dominated by Europe's debt crisis, all three indexes ended in the red.
In Asia, the Shanghai Composite (SHCOMP) gained 1.2% on Friday, while the Hang Seng (HSI) in Hong Kong edged up 0.2% and Japan's Nikkei (N225) added 0.7%. All three indexes also posted declines for the year.
* Video - Investors flee gold and hedge fundsCurrencies and commodities: The dollar rose agianst the the euro. The greenback slipped versus the British pound and the Japanese yen.
Oil for February delivery fell 82 cents to settle at $98.83 a barrel. Crude prices rose more than 8% in 2011, marking the third consecutive years of increases.
Gold futures for February delivery added $25.90, or 1.7%, to settle at $1,566.80 an ounce. That helped boost shares of gold ETF SPDR Gold Trust (GLD) as well as iShares Silver Trust (SLV). Gold prices rose more than 10% in 2011, logging an eleventh straight year of gains.
 Market Update
 4:30 pm : A flurry of afternoon selling left the major averages to settle at session lows. That basically put the S&P 500 back where it started the year. Although investors may not have scored the absolute return that they wanted, the stock market still exhibited relative strength while most of the world's other major equity averages suffered double-digit percentage declines in 2011.
Stocks displayed strength in the first part of the year. Specifically, the S&P 500 built on a 2% gain in January so that it was up more than 8% by the end of April. Things turned more volatile by summer, though. By early August, the broad market measure was down 11% on a year to date basis. The stock market's reversal came amid string of caustic events that included a spike in energy costs related to civic and social unrest in the Middle East and North Africa, the aftereffects of a massive earthquake and tsunami in Japan, the eurozone’s sovereign debt crisis, and debilitating debt ceiling negotiations in the U.S. that preceded the decision by analysts at Standard & Poor’s to downgrade the U.S. debt rating from AAA to AA+.
This year may have seen highly correlated and extremely volatile trading action, but fundamental factors ultimately provided support throughout the year. Despite that, they took a back seat to macro themes that drove large, headline-driven swings.
Some of the more notable themes that contributed to the volatility of 2011 are discussed in greater detail below.
* Middle East Tensions Evolving into Arab Spring: The first obstacle to a smooth 2011 was the escalation of tensions in the Middle East. This began in late 2010 with Tunisia and intensified with Egypt. Libya became a focal point of revolution in the region. The transition to freer societies is a positive, but accompanying uncertainty in the oil-rich region sent energy prices drastically higher. That induced equity market volatility and economic concerns before the price spike subsided.
* Japan's Earthquake/Tsunami: Damage in Japan from what was reported to be the most powerful earthquake to ever hit the country caused a nuclear crisis and derailed production in the country. The toll on the country's economy created concerns for the global economic recovery.
* European Debt Problems: The problems for the European Union were a nettlesome factor all year. The troubles of Greece, Ireland, Italy, Spain, and even France created precarious conditions in the core and periphery of the continent. Fears intensified as regional leaders struggled to craft comprehensive solutions to prevent a systemic banking crisis. The toll on confidence and the resulting economic outlook resulted in higher risk premiums and lower prices for risky assets such as stocks and the debt of risky European countries. European debt yields have come off of their highs, but they remain at historically high levels and present problematic funding costs.
* U.S. Debt Debacle and Subsequent Downgrade: Although Europe’s fiscal problems are much more of an immediate concern than what the U.S. faces, the eventual increase of the U.S. debt ceiling was a disappointing process. Most market participants had believed lawmakers would come to an agreement, but the process became dramatic and drawn-out. That chipped away at confidence in the abilities of legislative leaders. And even though a temporary deal was eventually reached, analysts at Standard & Poor's took the unprecedented step of downgrading the U.S. credit rating, which now stands at AA+, down from AAA. Analysts wrote that the downgrade reflected opinions that fiscal consolidation plans fall short of what would be necessary to stabilize the government's medium-term debt dynamics.
Other Themes of 2011: * Earnings Growth Remained Strong, Market Valuation Attractive: The S&P 500 earnings estimates on an adjusted basis for 2011 are up 3.2% over the last 12 months as companies continue to exceed the Street’s expectations. Annual earnings growth is now expected to approach 12% after growing 38% in 2010. As for 2012, earnings growth of nearly 9% is widely expected. In turn, the S&P 500 currently trades a little north of 12x adjusted FY12 earnings estimates. One year ago, with the S&P 500 trading at almost the same price level, the stock market traded at a little less than 14x FY11 earnings estimates.
* Monetary Policy Changes Form but Remains Accommodative: The end of the Fed's second installment of quantitative easing came in early summer. It was replaced by a more unconventional policy involving selling shorter maturity issues and purchasing longer-dated bonds so as to keep long rates low and extend the maturity of the Fed’s portfolio. The Fed has stated it wants to keep rates low until at-least mid-2013.
* IPO Market Stymied by Fall Volatility; 2012 Pipeline Strong: Initial Public Offerings (IPOs) slowed in number and capital raised. The 334 global offerings, which raised about $135 billion, represented a 30% decline from last year. Fervor fizzled amid concerns about Europe and the macro environment.
* Occupy Wall Street Gains Steam: Protests about Wall Street pay and practices spread around the world despite its initial lack of direction and focus, but many became sympathetic to messages of resentment that the movement symbolizes. The movement may gain steam as the presidential election draws closer.
It is widely believed that the European situation is the biggest risk for 2012, but it is generally factored in to market values. Other variables that are likely to play a part in market valuations and volatility include the trajectory of China’s economy, the political dynamics ahead of the 2012 U.S. presidential election, and geopolitical issues around the world. DJ30 -69.48 NASDAQ -8.59 NQ100 -0.3% R2K -0.5% SP400 -0.5% SP500 -5.42 NASDAQ Adv/Vol/Dec 1196/1.05 bln/1398 NYSE Adv/Vol/Dec 1427/587 mln/1577
3:30 pm : The broad commodities complex closed out 2011 in mixed fashion, but strength among precious metals helped give the CRB Index a 0.3% gain for the session. That added marginally to the CRB's December gain, which totaled 2.4%, but did little to pare its annual loss, which amounted to 8.3%. Last year the CRB scored a 17% gain.
Among the more closely tracked commodities, oil prices slipped 0.8% to settle pit trade at $98.83 per barrel. Futures prices pushed more than 8% higher this year, building on the 15% gain that they achieved in 2010.
Natural gas prices closed pit trade at $3.08 per MMBtu, or flat for the session, but 30% below where prices started the year. That comes on top of the near 21% drop that they suffered last year.
As for precious metals, gold and silver both climbed 1.8% to settle pit trade at $1567.80 per ounce and $27.86 per ounce, respectively. However, gold prices climbed 10% this year, while silver prices slid 10% for the year. Last year, gold futures prices gained almost 30% while silver prices soared almost 84%. DJ30 -47.34 NASDAQ -3.11 SP500 -2.68 NASDAQ Adv/Vol/Dec 1250/675 mln/1330 NYSE Adv/Vol/Dec 1600/275 mln/1380
3:00 pm : The major equity averages are wrestling with modest losses as they enter the final hour of this year's final session. As things currently stand, the S&P 500 is up just a single point for the year. That comes after the benchmark Index climbed nearly 13% in 2010 and more than 23% in 2009.
Cabot (CBT 32.23, -0.04) and El Paso (EP 26.60, +0.15), a couple of energy plays, have been this year's top performing stocks in the S&P 500. While shares of CBT doubled in price, EP wasn't far behind. At the other end of the spectrum, NetFlix (NFLX 69.09, -0.21) fell more than 60% this year, making it one of the worst performers in the S&P 500 for 2011. Interestingly, that tumble comes after the stock sat atop the list of best performers for 2010, when the stock soared almost 220%. DJ30 -57.60 NASDAQ -4.11 SP500 -3.60 NASDAQ Adv/Vol/Dec 1250/630 mln/1330 NYSE Adv/Vol/Dec 1555/260 mln/1405
2:30 pm : A sudden flurry of selling pressure recently sent stocks to new session lows. The move halted when the S&P 500 hit the 1258 line, which is where the benchmark measure started this year. Although the S&P 500 is now completely flat for the year, it has been a better performer than many of the world's other major equity averages, many of which suffered double-digit percentage losses in 2011.DJ30 -57.40 NASDAQ -4.26 SP500 -3.88 NASDAQ Adv/Vol/Dec 1335/565 mln/1225 NYSE Adv/Vol/Dec 1690/230 mln/1250
2:00 pm : The S&P 500 is currently positioned for a weekly loss of about 0.3%, which is also where it sits for the year. Over the course of the month, though, the broad market measure has managed to gain little more than 1%.
The Dow has fared only slightly better during December, but what's most impressive is that it boasts an annual gain of almost 6%. As for the Nasdaq, it is down fractionally for December, and off by little more than 1% for the year. DJ30 -38.37 NASDAQ +0.62 SP500 -1.89 NASDAQ Adv/Vol/Dec 1340/525 mln/1215 NYSE Adv/Vol/Dec 1725/210 mln/1200
1:30 pm : Stocks continue to chop along in lackluster fashion. That has kept the major averages close to the flat line.
With stocks muddling along, Treasuries have managed to maintain modest gains. The Treasury market will close at 2:00 PM ET today and will re-open for regular trading hours on Tuesday, January 3. DJ30 -36.75 NASDAQ +0.33 SP500 -1.96 NASDAQ Adv/Vol/Dec 1300/475 mln/1250 NYSE Adv/Vol/Dec 1695/200 mln/1225
1:00 pm : The major equity averages are mixed in their final session of the year. Action has been both listless and lackluster from the start.
Without any real catalysts for trade stocks have been left to muddle along. Although that is making for an unexciting conclusion to 2011, it has kept the S&P 500 only incrementally positive for the year. Such a paltry gain may be unimpressive in an absolute sense, but it is far better than the double-digit percentage drops that many of the world's other major equity averages have suffered this year.
The stock market's relative strength is a testament to its resilience in the face of the many frightening headlines and persistent problems that have plagued investor confidence this year. Among the more salient themes, Japan suffered the toll of a massive earthquake and tsunami, and the Middle East, North Africa, and Europe all experienced civil and social unrest. Even many of the major U.S. cities have been wrapped up in the occupy Wall Street effort. There was the U.S. debt ceiling negotiation debacle, which preceded an unprecedented decision by Standard & Poor's to downgrade the AAA debt rating of the U.S. Concerns of sovereign debt contagion in the eurozone linger.
Although domestic stocks displayed resilience in 2011, Treasuries still attracted plenty of buyers. That drove down the yield on the benchmark 10-year Note from roughly 3.30% at the start of the year to less than 1.90% today.
The dollar is down about 0.3% today after it had flirted with its multi-month high earlier this week. The greenback is currently on track for a 1.5% annual gain.
The dollar's downturn today has bolstered buying interest in gold, such that the yellow metal is sporting a 2.3% gain at $1577 per ounce. Gold futures prices have climbed more than 11% this year. DJ30 -33.64 NASDAQ +1.38 SP500 -1.48 NASDAQ Adv/Vol/Dec 1305/435 mln/1235 NYSE Adv/Vol/Dec 1700/185 mln/1215
12:30 pm : Amid many frightening headlines this year -- civil and social unrest in the Middle East, North Africa, Europe, and even on Wall Street, the earthquake and tsunami in Japan, sovereign debt contagion in the eurozone, the U.S. debt ceiling negotiation debacle, and an unprecedented downgrade of the AAA debt rating for the U.S. by Standard & Poor's -- Treasuries have performed quite well. Their climb in price has taken down the yield on the benchmark 10-year Note from nearly 3.30% at the start of the year to less than 1.90% today.DJ30 -32.02 NASDAQ +0.39 SP500 -1.63 NASDAQ Adv/Vol/Dec 1295/385 mln/1205 NYSE Adv/Vol/Dec 1710/165 mln/1200
12:00 pm : Stocks continue to slog along in their final session of 2011. Although action has been lackluster, the S&P 500 is still up fractionally for the year. So even though participation is limited because so many traders are on holiday vacations (U.S. markets will be closed on Monday in observance of New Year's Day), many will still want to know at session's end if the stock market was able to hold steady in positive territory or end the trading year with a whimper and close below the unchanged line.
Although the stock market's performance this year has been underwhelming on an absolute basis, it has been a strong performer on a relative basis. Among Europe's major bourses, Germany's DAX dropped more than 15% this year, France's CAC fell 17%, and Britain's FTSE finished the year nearly 6% below where it began. As for Asia's major averages, Japan's Nikkei descended 17% while Hong Kong's Hang Seng tumbled 20%. DJ30 -25.62 NASDAQ +0.45 SP500 -1.60 NASDAQ Adv/Vol/Dec 1260/320 mln/1205 NYSE Adv/Vol/Dec 1780/145 mln/1100
11:30 am : The dollar has extended its decline so that it now trails a collection of competing currencies by about 0.4%. That has helped bolster buying interest in gold prices, which recently climbed to a new session high of almost $1580 per ounce for a 2.5% gain. Gold futures prices have climbed more than 11% this year.
Although the major equity averages are mostly mixed today, higher gold prices have taken the SPDR Gold Trust ETF (GLD 153.54, +3.20) higher for a heady gain. In fact, GLD shares are now at a session high and sporting a gain greater than 2%; the ETF is up more than 10% in 2011. DJ30 -10.03 NASDAQ +1.91 SP500 -0.01 NASDAQ Adv/Vol/Dec 1155/255 mln/1275 NYSE Adv/Vol/Dec 1720/120 mln/1160
11:00 am : Stocks recently pushed into positive territory with help from a rising euro, which now trades with a 0.3% lead over the greenback after it had been down fractionally this morning. Although the euro has maintained a modest gain, stocks have faltered since their recent push, leaving the major equity averages to muddle along near the neutral line.
Financials, which provided leadership in the prior session by climbing in excess of 1%, have been a bit of a drag today. The sector is currently down 0.3%. DJ30 -15.25 NASDAQ +0.10 SP500 -0.47 NASDAQ Adv/Vol/Dec 1035/200 mln/1365 NYSE Adv/Vol/Dec 1605/100 mln/1220
10:30 am : The dollar index is lower this morning, which is giving a boost to most commodities.
Crude oil, however, has been in the red for most of today's session. The energy component did hit a new session low of $98.61/barrel around 9:45am EST, but quickly reversed and rallied back into positive territory. In recent activity, crude is down 0.1% at $99.55/barrel.
Natural gas has been choppy and is currently down 0.4% at $3.04/MMBtu.
Precious metals are showing nice gains this morning, led by silver. Gold hit its current session high of $1575.00/oz and is back near that level in current trade. Silver ran as high as $28.26/oz in early morning activity and is now up 2.7% at $28.05/oz. Gold is 2.0% higher at $1572.30/oz.
Grains rose in the overnight session with corn rising 1.1% at $6.45/bushel, wheat gaining 1.1% at $6.53/bushel.DJ30 -22.78 NASDAQ -1.86 SP500 -1.27 NASDAQ Adv/Vol/Dec 999/170 mln/1364 NYSE Adv/Vol/Dec 1597/93 mln/1223
10:00 am : The major equity averages have improved their positions, but they haven't yet managed to generate enough momentum to move above the neutral line. Legitimate leadership is still lacking.
Lackluster action among stocks has helped Treasuries tick higher. Although the move has been only modest, it is still enough to take the yield on the benchmark 10-year Note back below 1.90%. DJ30 -4.73 NASDAQ +1.71 SP500 +0.43 NASDAQ Adv/Vol/Dec 790/55 mln/1335 NYSE Adv/Vol/Dec 1285/50 mln/1350
09:45 am : Stocks are down narrowly in the opening minutes of trade. The move lower has been relatively broad in that the majority of the major sectors are in negative territory, albeit with losses that range from fractional to modest.
Materials are showing some relative strength in the early going, however. The sector is up 0.2% with help from a few metals and miners players. DJ30 -21.72 NASDAQ -2.28 SP500 -1.58 NASDAQ Adv/Vol/Dec NA/NA/NA NYSE Adv/Vol/Dec NA/NA/NA
09:15 am : S&P futures vs fair value: flat. Nasdaq futures vs fair value: -5.10. Stock futures suggest a flat to lower start for the final session of the year is in order. Mixed action abroad, modest movements by the euro and dollar, and an absence of corporate news and data have left market participants with few directional cues. That will essentially leave the stock market to trade under its own volition. So, the question is whether or not stocks will remain fractionally positive or drift down to a loss for the year.
09:05 am : S&P futures vs fair value: -0.30. Nasdaq futures vs fair value: -6.10. Oil prices closed the prior session with a modest gain, but they are down 0.7% to $98.95 per barrel in early pit trade. Natural gas prices are also under pressure; after a flat finish yesterday the energy component is currently down 0.3% at $3.05 per MMBtu. Precious metals are pushing higher after a mixed finish for the prior session. Specifically, gold prices are up 1.7% to $1566 per ounce after the yellow metal settled the prior session with a 1.4% loss. As for silver, it is up 2.1% to $27.88 per ounce as it builds on its prior session bounce, which saw the precious metal rally out of the red for a 0.3% gain.
08:35 am : S&P futures vs fair value: +0.10. Nasdaq futures vs fair value: -5.90. Domestic stock futures have drifted lower in recent trade. They continue to receive few directional cues from Europe's major bourses, which have seen mixed action in their final session of the year. Britain's FTSE has mustered only a fractional gain in its final session of 2011, but it remains positioned for an annual loss on the order of 5%. France's CAC is currently up fractionally, too. Strength in Lafarge, Renault, and Michelin is being offset by financials, which have been a broad market burden all year. The CAC is facing an annual loss of almost 18%. Germany's DAX has already closed for the day. Commerzbank and Daimler (DAI 43.71, +0.00) helped take it to a 0.9% gain in its final session of the year. That did little to offset its 15% annual loss, though.
Action in Asia was mixed in the final session of the year. Japan's Nikkei scored a 0.7% gain, but still suffered a 17% loss for the year. In the latest round of trade Japan Steel and Kubota (KUB 40.48, +0.00) were top performers, but Isuzu Motors and Softbank were weak. Hope for a reduction in the reserve requirement ration helped banks give Hong Kong's Hang Seng a 0.2% gain in its final session of 2011, but the Hang Seng still suffered a 20% loss for the year.
Note: all ticker quotes reflect premarket prices.
08:05 am : S&P futures vs fair value: +1.50. Nasdaq futures vs fair value: -2.10. Stocks enter the final session of 2011 with a fractional year-to-date gain after broad-based buying on very thin volume pushed the S&P 500 past its 200-day moving average and its 2011 starting point yesterday. However, the mood among premarket participants is nearly neutral in that stock futures are up only narrowly above fair value. Meanwhile, both the euro and the dollar are down fractionally. Corporate news flow is slow, there are no economic items on today's calendar, and U.S. markets closed on Monday in observance of New Year's Day, so trade is expected to be minimal and action is likely to be quiet in the final session of 2011.
06:24 am : [BRIEFING.COM] S&P futures vs fair value: +0.70. Nasdaq futures vs fair value: -3.60.
06:23 am : Nikkei...8455.35...+56.50...+0.70%. Hang Seng...18434.39...+36.50...+0.20%.
06:23 am : FTSE...5550.98...-15.80...-0.30%. DAX...5826.64...+13.90...+0.20%.
Special thanks to Bloomberg, CNNMoney and Yahoo! Finance for their market summaries. 
Best Regards,
M.A. Perry
Trader and Founder of
WRB Analysis (wide range body/bar analysis)
Price Action Trading (no technical indicators)

@
http://twitter.com/wrbtrader and http://stocktwits.com/wrbtrader Phone: +1.708.572.4885
Business Hours: 8am - 5pm est (Mon - Fri)
Skype Messenger: kebec2002
intradaystrategies@yahoo.com questions@thestrategylab.comGo Back To TheStrategyLab.com Homepage