 Trade Results of M.A. Perry
 Trader and Founder of
WRB Analysis (wide range body/bar analysis)
Price Action Trading (no technical indicators)
Attachment:
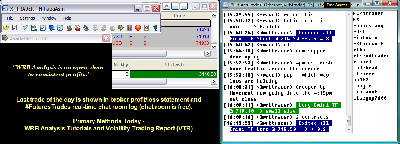 111711-wrbtrader-PnL-Blotter-Profit-3110.png [ 75.26 KiB | Viewed 300 times ]
click on the above image to view today's performance verification Trade Performance for Today: +31.10 points or
$3110 dollars in the Russell 2000 Emini TF ($TF_F) Futures.
Russell 2000 Emini TF Futures - 1 tick or 0.10 = $10.00 dollars and there's more contract information @
The ICE.
S&P 500 Emini ES Futures - 1 tick or 0.25 = $12.50 dollars and there's more contract information @
CMEGroup.
In addition, all trades were posted real-time in the
free #FuturesTrades chat room. Today's
#FuturesTrades trading chat room logs provides details (e.g. time, price, contract size) about each one of my trades from entry to exit along with price action commentary as the trade traversed...all archived
@ http://www.thestrategylab.com/ftchat/forum/viewtopic.php?f=96&t=1058.
To join our
free chat room...
registration instructions located at a different forum
@ http://www.thestrategylab.com/ftchat/forum/viewtopic.php?f=5&t=630Also, posted below are direct links to information about my
trade methodology and
trading plan (there's a difference between the two) that enables me to identify key trading areas in the price action that represent changes in supply/demand and volatility along with being able to exploit these changes via WRB Analysis (wide range body/bar analysis).
 WRB Analysis Tutorials
 @
http://www.thestrategylab.com/WRBAnalysisTutorials.htm and there's a
free study guide of the WRB Analysis Tutorial Chapters 1, 2 and 3 @
http://www.thestrategylab.com/tsl/forum/viewtopic.php?f=119&t=718.
Volatility Trading Report (VTR) @
http://www.thestrategylab.com/VolatilityTrading.htm and there's a
free trade signal strategy @
http://www.thestrategylab.com/tsl/forum/viewforum.php?f=89 so that you can freely test drive one of our trade strategies with support
prior to purchasing the Volatility Trading Report (VTR).
Trading Plan Daily Routine @
http://www.thestrategylab.com/tsl/forum/viewtopic.php?f=145&t=1269 -----------------------------
Market Summaries The below summaries by
Bloomberg,
CNNMoney and
Yahoo! Finance helps me to do a quick review of the fundamentals, FED/ECB/IMF actions or any important global economic events that had an impact on today's price action. Simply, I'm a strong believer that many variables (key market events) causes key changes in supply/demand and volatility that results in swing points and strong continuation price actions. Thus, I pay attention to these key market events from one trade to the next trade to give me the
market context for my
technical analysis. Just as important, these summaries becomes my
archives to allow me to understand what was happening on any given trading day in the past...something I can not get from my broker statements alone.
U.S. Stocks Fall on Concern About Italy and Spain Nov. 17 (Bloomberg) -- Bloomberg's Ellen Braitman reports on the performance of the U.S. equity market today. U.S. stocks fell, sending the Standard & Poor's 500 Index to the lowest level in a month, as concern grew that Europe's debt crisis will worsen and lawmakers will fail to agree on plans to cut the American deficit.
Attachment:
 111711-Key-Price-Action-Markets.png [ 537.23 KiB | Viewed 270 times ]
 Market Update
 4:30 pm : Continued lack of leadership caused stocks to struggle in the face of resistance, which ultimately gave way to a technical breakdown that resulted in steep losses for the major averages.
Sellers hit stocks at the open. The major averages fought back some, but their efforts lacked leadership. That hampered the broad market and kept it from poking into positive territory. Most notably, though, a barrage of selling was brought about by the inability of the S&P 500 to push back above a rising trendline that formed the bottom of a triangle pattern and a simultaneous pullback by the euro.
The slide stabilized once the S&P 500 found the 1210 zone, setting a near one-month low, but stocks never really rebounded from there. The euro also drifted into the close, resulting in only a fractional gain for the day. It is on pace for a 2% weekly loss.
Participation picked up in response to the market's volatility. In recent session's share volume has been anemic, but today it approached 1 billion on the Big Board.
Market movement distracted participants from a dose of generally pleasing data, which featured the latest weekly initial jobless claims count. Initial jobless claims for the week ended November 12 totaled 388,000. Not only is that less than the 398,000 initial claims that had been broadly expected, it marked the lowest initial claims level since April.
Housing starts in October hit an annualized rate of 628,000, which is little changed from the downwardly revised rate of 630,000 units in the prior month, but greater than the pace of 604,000 that had been generally expected. Building permits set an annualized pace of 653,000 to exceed the rate of 603,000 that had been anticipated. Building permits in the prior month had trended at an annualized pace of 589,000.
The Philadelphia Fed Survey for November slipped to 3.6 from 8.7 in the prior month. Many had expected to ease to just 7.5.
Advancing Sectors: (None)
Declining Sectors: Telecom -0.5%, Consumer Staples -0.5%, Utilities -0.6%, Health Care -1.2%, Consumer Discretionary -1.7%, Industrials -1.8%, Financials -2.1%, Energy -2.1%, Tech -2.2%, Materials -2.9%DJ30 -134.86 NASDAQ -51.62 NQ100 -2.3% R2K -1.5% SP400 -1.9% SP500 -20.78 NASDAQ Adv/Vol/Dec 710/2.21 bln/1787 NYSE Adv/Vol/Dec 577/983 mln/2445
3:30 pm : Gold and silver futures sold off sharply today. Gold ended lower by 3% at $1720.20 per ounce, while silver shed 7% to finish at $31.50 per ounce. Both metals cratered as market participants covered positions in the precious metals to cover losses in other asset classes. Gold futures put in lows at $1711, their lowest levels since Nov 1. Silver traded as low as $31.04, its lowest levels since Oct 21… The weakness in equities pressured crude oil futures, which shed % to settle at $ per barrel. Futures gave back all of yesterday’s gains and finished back below the $99 level. Natural gas surged on the heels of this morning’s inventory data, which posted a smaller-than-expected build. Futures traded as high as $3.48 before pulling back to the flat line in late-morning trade. Natural gas did manage to bounce off the unchanged line to recoup some gains, but ended well below session highs. On the day natural gas gained 1.9% to finish at $3.41.DJ30 -171.65 NASDAQ -53.36 SP500 -22.59 NASDAQ Adv/Vol/Dec 783/1.8 bln/1710 NYSE Adv/Vol/Dec 579/708.1 mln/2457
3:00 pm : Stocks are testing the top end of their afternoon trading range, but they haven't been able to make any kind of meaningful move beyond that point. In turn, stocks enter the session's final hour facing steep losses.
Few stocks have been spared from the sell-off. In fact, all 30 Dow components are in negative territory while the only major sectors that have managed to limit their losses to less than 1% are defensive-oriented plays like telecom (-0.9%), consumer staples (-0.8%), and utilities (-0.7%). Declining volume outnumbers advancing volume on the NYSE by more than 12-to-1. DJ30 -176.04 NASDAQ -51.36 SP500 -22.83 NASDAQ Adv/Vol/Dec 690/1.57 bln/1780 NYSE Adv/Vol/Dec 500/605 mln/2475
2:30 pm : Stocks have been unable to generate any kind of a bounce off of session lows. Persistent pressure has things shaping up for the stock market's poorest back-to-back performance in a couple of weeks. Worse still is that a sizable loss this past Monday has the stock market on pace for its worst week in a month.DJ30 -197.91 NASDAQ -55.78 SP500 -24.37 NASDAQ Adv/Vol/Dec 720/1.47 bln/1720 NYSE Adv/Vol/Dec 555/+550 mln/2425
2:00 pm : Stocks continue to chop along session lows amid widespread weakness. The action has stoked volatility, such that the Volatility Index, which is frequently labeled the Fear Gauge, is up more than 7% so that it trades near its one-month high.
Participation has picked up with the market's recent sell-off. In turn, share volume on the NYSE is flirting with 500 million. For comparison, share volume on the Big Board was barely at a half billion when stocks entered the final hour of trade yesterday. DJ30 -173.01 NASDAQ -53.20 SP500 -21.35 NASDAQ Adv/Vol/Dec 760/1.32 bln/1660 NYSE Adv/Vol/Dec 560/490 mln/2390
1:30 pm : Stocks are still trying to recover from a recent breakdown, which dropped the major equity averages to session lows. The market's rollover came after the S&P 500 failed to push back above a recent trendline that was set along the lower end of its recent trading range. The inability to bounce in the face of upside resistance also coincided with the euro's drift off of its session high -- the euro now leads the dollar by 0.2%, which is about one-third of what it had traded at earlier today.DJ30 -159.39 NASDAQ -52.09 SP500 -20.21 NASDAQ Adv/Vol/Dec 715/1.18 bln/1690 NYSE Adv/Vol/Dec 560/435 mln/2375
1:00 pm : The major equity averages are off of session lows following a barrage of selling pressure. The broad market is now down nearly 4% for the week, putting stocks on pace for their worst weekly performance since September.
Prior session trade ended on a down note with sizable losses, but the mood among premarket participants seemed as if it had improved with news that weekly initial jobless claims made a surprise decline to a multi-month low of 388,000 and both housing starts and building permits for October proved better than expected with annualized rates of 628,000 and 653,000, respectively. However, the toll of the opening bell stirred sellers.
A November Philadelphia Fed Survey reading of 3.6, down from 8.7 in the prior month, was generally shrugged off by both buyers and sellers, but stocks eventually fought through some of the early selling pressure. That gave the Dow a modest gain, but the S&P 500 was rebuffed at the neutral line and the Nasdaq never shook off the drag of tech stocks. The inability to bounce gave way to a breakdown that recently dropped the broad market to its lowest level in almost one month.
Tech stocks, especially semiconductor issues, have been trading with pronounced weakness all session. The sector is currently down 2.5%, which makes it the poorest performing group of the day. What's more, tech stocks collectively make up the largest sector by market weight, exacerbating its toll on trade.
Even with all 10 major sectors in negative territory, traditional safe havens aren't garnering a great deal of support. In fact, the benchmark 10-year Note is up only a few ticks and the dollar is actually down against a collection of competing currencies, namely the euro and the sterling pound. Even amid the dollar's decline and broad market weakness gold prices are down 3% to $1718 per ounce. DJ30 -151.36 NASDAQ -51.27 SP500 -19.96 NASDAQ Adv/Vol/Dec 735/1.07 bln/1645 NYSE Adv/Vol/Dec 590/390 mln/2335
12:30 pm : The Nasdaq has moved another leg down to set new session lows. Tech stocks continue to weigh heavily on it. As a sector, tech stocks are now down 1.5% with names like Oracle (ORCL 31.36, -0.63) and Adobe (ADBE 27.84, -0.70) grappling with pronounced selling pressure.
The Dow has managed to limit its move lower with help from blue chips like Verizon (VZ 37.00, +0.35) and Exxon Mobil (XOM 78.77, +0.52). That said, financial outfits JPMorgan Chase (JPM 31.05, -0.42) and American Express (AXP 47.28, -0.84) are dragging on the Dow.
12:00 pm : Europe's major bourses recently closed for the day. Trade there was decidedly weak once again. Among the more widely watched averages, Germany's DAX dropped by 1.2%, Britian's FTSE fell 1.5%, and France's CAC closed 1.9% lower. Despite such weak market sentiment, the euro continues to sport an impressive gain against the greenback. It was last quoted 0.5% higher at $1.352. The euro's bounce comes after it logged losses in each of the three previous sessions.DJ30 -4.39 NASDAQ -19.00 SP500 -4.54 NASDAQ Adv/Vol/Dec 1320/775 mln/995 NYSE Adv/Vol/Dec 1495/280 mln/1375
11:30 am : Pressure against tech stocks, which have descended to a 1.2% loss, has the Nasdaq trailing its counterparts and trading modestly above its session low. Semiconductor stocks, down almost 3% based on the Philadelphia Semiconductor Index, remain a primary source of weakness.DJ30 +6.22 NASDAQ -15.98 SP500 -3.89 NASDAQ Adv/Vol/Dec 1120/640 mln/1175 NYSE Adv/Vol/Dec 1215/235 mln/1600
11:00 am : The broad market recently worked its way up to the neutral line, but it has failed to poke into positive territory. Tech stocks continue to hamper action. The sector is currently down 0.8%, making it the poorest performing group. What's more, tech stocks collectively make up the largest sector by market weight.
In contrast to the past few sessions, financials are actually showing some strength, although it is moderate. The sector is currently up 0.1% with help from bank stocks, which are bouncing back from their drubbing in the prior session. Such newfound strength has the KBE Bank Index up nearly 1%. DJ30 +14.19 NASDAQ -14.17 SP500 -2.56 NASDAQ Adv/Vol/Dec 1255/510 mln/980 NYSE Adv/Vol/Dec 1495/195 mln/1270
10:35 am : Commodities are lower again today despite modest weakness in the dollar index.
Crude oil futures have pulled back this morning following yesterday's notable gains on the news that Enbridge and Enterprise would reverse the direction of crude oil flows on the Seaway pipeline. In current trade, crude is down 1.2% at $101.38/barrel.
Natural gas futures were trading about $1.2% higher at $3.53/MMBtu just ahead of today's weekly inventory data. Following the data, which showed a build of 19 bcf versus expectations of 26 bcf, nat gas spiked and is now up 3.3% at $3.60/MMBtu.
Precious metals are in the red this morning with silver showing the worst losses. Gold and silver hit a new session low about 45 minutes ago (Gold $1733, Silver $32.54) and both precious metals have only partially recovered from those lows. Gold is now down 1.6% at $1745.40/oz and silver is 3.1% lower at $32.79/oz.DJ30 +8.03 NASDAQ -12.50 SP500 -3.85 NASDAQ Adv/Vol/Dec 1101/449 mln/1102 NYSE Adv/Vol/Dec 1273/176 mln/1475
10:00 am : The Philadelphia Fed Survey for November was just released. It fell to 3.6 from 8.7 in the prior month, but had only been expected to ease to 7.5.
Stocks haven't really reacted to the relatively disappointing report. That has left the major equity averages mired in negative territory with modest losses. DJ30 -31.33 NASDAQ -12.51 SP500 -6.55 NASDAQ Adv/Vol/Dec 800/155 mln/1190 NYSE Adv/Vol/Dec 865/67 mln/1725
09:45 am : Selling have been stirred into action in the first few minutes of trade, despite what had appeared to be an improving tone ahead of the open. Efforts to push stocks lower have been rather broad based thus far; in fact, nine of the 10 major sectors are in negative territory.
Telecom is the only sector that has refused to roll into the red. That said, the sector isn't exactly sporting any kind of a heady gain. Instead, it is up only fractionally.
Tech stocks are at the opposite end of the spectrum, trading with a 0.8% loss. Semiconductor stocks are in particularly weak shape. DJ30 -45.26 NASDAQ -13.39 SP500 -5.99 NASDAQ Adv/Vol/Dec NA/NA/NA NYSE Adv/Vol/Dec NA/NA/NA
09:15 am : S&P futures vs fair value: -0.90. Nasdaq futures vs fair value: -3.30. After a steady effort to work their way up from morning lows, stock futures now point to a relatively flat start to today's trade. The improved tone comes amid news that weekly initial jobless claims fell more than expected to their lowest level since April. Data also featured some pleasing housing starts and building permits numbers. That has helped bolster buying interest, even though most of Europe's major bourses are down markedly once again. Although Europe's bourses continue to descend, suggestive of weak market sentiment, the euro is staging an advance against the greenback. The currency is currently at a morning high of $1.352, sporting a 0.6% gain.
09:05 am : S&P futures vs fair value: -1.00. Nasdaq futures vs fair value: -3.30. General weakness among commodities has the CRB Index down 0.7% this morning. Oil prices climbed to multi-month highs in the prior session, but they are down in the opening minutes of pit trade -- last quoted with a 0.9% loss at $101.65 per barrel. Natural gas prices have been bid higher ahead of the weekly inventory report at 10:30 AM ET. The energy component is currently up 1.4% to $3.53 per MMBtu. Precious metals prices are under pressure. Specifically, gold prices are down 1.4% to $1750 per ounce, while silver prices are at $33.13 per ounce for a 2.0% loss.
08:35 am : S&P futures vs fair value: -2.30. Nasdaq futures vs fair value: -5.30. The latest dose of data has helped stock futures extend their move up from morning lows. Initial jobless claims for the week ended November 12 totaled 388,000, which is down 5,000 from the prior week and less than the 398,000 initial claims that had been expected, on average, among economists polled by Briefing.com. Continuing claims totaled about 3.61 million, which is down from roughly 3.67 million for the prior week.
Housing starts for October were also just released. They hit an annualized rate of 628,000, which is little changed from the downwardly revised rate of 630,000 units in the prior month, but greater than the pace of 604,000 that had been generally expected.
Building permits also bested expectations. They hit an annualized rate of 653,000 when a pace of only 603,000 had been anticipated. The pace of building permits also picked up from the prior month, when it totaled 589,000.
08:05 am : S&P futures vs fair value: -8.20. Nasdaq futures vs fair value: -15.50. Stocks slid late in the prior session to settle at their daily lows. Moderate selling pressure has extended into pre-market trade, reflecting weak sentiment in Europe, where the region's major bourses are down markedly following a negative reaction to the latest debt auction from Spain.
Despite the weak tone of trade across the Atlantic, the euro is sporting a 0.4% gain against the greenback. It is still down nearly 2% for the week, though.
Earnings news continues to be of little consequence to the overall market, but participants get a dose of data at the bottom of the hour, when the latest in housing starts and weekly initial jobless claims are posted. At 10:00 AM ET participants get their hands on the latest Philadelphia Fed Survey.
06:55 am : S&P futures vs fair value: -6.70. Nasdaq futures vs fair value: -14.00.
06:55 am : Nikkei...8479.63...+16.50...+0.20%. Hang Seng...18817.47...-143.40...-0.80%.
06:55 am : FTSE...5437.79...-71.20...-1.30%. DAX...5857.57...-55.80...-0.90%.
Special thanks to Bloomberg, CNNMoney and Yahoo! Finance for their market summaries. 
Best Regards,
M.A. Perry
Trader and Founder of
WRB Analysis (wide range body/bar analysis)
Price Action Trading (no technical indicators)

@
http://twitter.com/wrbtrader and http://stocktwits.com/wrbtrader Phone: +1.708.572.4885
Business Hours: 8am - 5pm est (Mon - Fri)
Skype Messenger: kebec2002
questions@thestrategylab.comGo Back To TheStrategyLab.com Homepage


