 Trade Results of M.A. Perry
 Trader and Founder of
WRB Analysis (wide range body/bar analysis)
Price Action Trading (no technical indicators)
Attachment:
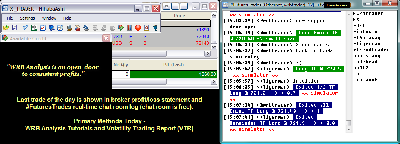 111011-wrbtrader-PnL-Blotter-Profit-1360.png [ 74.47 KiB | Viewed 286 times ]
click on the above image to view today's trading summary Trade Performance for Today: +13.60 points or
$1360 dollars in the Russell 2000 Emini TF ($TF_F) Futures.
Russell 2000 Emini TF Futures - 1 tick or 0.10 = $10.00 dollars and there's more contract information @
The ICE.
S&P 500 Emini ES Futures - 1 tick or 0.25 = $12.50 dollars and there's more contract information @
CMEGroup.
In addition, all trades were posted real-time in the
free #FuturesTrades chat room. Today's
#FuturesTrades trading chat room logs provides details (e.g. time, price, contract size) about each one of my trades from entry to exit along with price action commentary as the trade traversed...all archived
@ http://www.thestrategylab.com/ftchat/forum/viewtopic.php?f=96&t=1052.
To join our
free chat room...
registration instructions located at a different forum
@ http://www.thestrategylab.com/ftchat/forum/viewtopic.php?f=5&t=630Also, posted below are direct links to information about my
trade methodology and
trading plan (there's a difference between the two) that enables me to identify key trading areas in the price action that represent changes in supply/demand and volatility along with being able to exploit these changes via WRB Analysis (wide range body/bar analysis).
 WRB Analysis Tutorials
 @
http://www.thestrategylab.com/WRBAnalysisTutorials.htm and there's a
free study guide of the WRB Analysis Tutorial Chapters 1, 2 and 3 @
http://www.thestrategylab.com/tsl/forum/viewtopic.php?f=119&t=718.
Volatility Trading Report (VTR) @
http://www.thestrategylab.com/VolatilityTrading.htm and there's a
free trade signal strategy @
http://www.thestrategylab.com/tsl/forum/viewforum.php?f=89 so that you can freely test drive one of our trade strategies with support
prior to purchasing the Volatility Trading Report (VTR).
Trading Plan Daily Routine @
http://www.thestrategylab.com/tsl/forum/viewtopic.php?f=145&t=1269 -----------------------------
Market Summaries The below summaries by
Bloomberg,
CNNMoney and
Yahoo! Finance helps me to do a quick review of the fundamentals, FED/ECB/IMF actions or any important global economic events that had an impact on today's price action. Simply, I'm a strong believer that many variables (key market events) causes key changes in supply/demand and volatility that results in swing points and strong continuation price actions. Thus, I pay attention to these key market events from one trade to the next trade to give me the
market context for my
technical analysis. Just as important, these summaries becomes my
archives to allow me to understand what was happening on any given trading day in the past...something I can not get from my broker statements alone.
U.S. Stocks Rise on Jobless Data as Euro Concern Eases Nov. 10 (Bloomberg) -- Bloomberg's Deborah Kostroun reports on the performance of the U.S. equity market today. U.S. stocks advanced, rebounding from yesterday's tumble, as jobless claims declined while a retreat in Italian bond yields and the selection of a new Greek premier tempered concern about Europe's debt crisis.
Attachment:
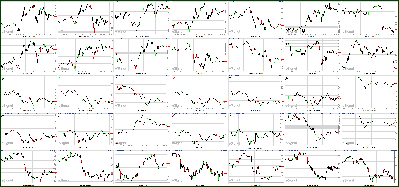 111011-Key-Price-Action-Markets.png [ 523.96 KiB | Viewed 275 times ]
 Market Update
 4:30 pm : Both the Dow and S&P 500 scored strong gains today, but lackluster action among tech stocks left the Nasdaq to end the day only narrowly above the neutral line.
The risk trade was turned back on this morning. Participants put in the past the prior session's slump, which was the worst one-day percentage drop for the S&P 500 about three months, to bid stocks higher in the early going. Buyers were compelled by improved market conditions in Europe and, partly, because Italy held a successful auction of 12-month bills. Although the auction commanded a yield comfortably above 6.0%, demand for the country's debt suggested that investors haven't completely given up on the country.
Improved sentiment in Europe helped take the euro higher after it had dropped about 2% against the dollar yesterday. Today it climbed about 0.6% to $1.361.
With an opening gain on the order of 1% things were looking for stocks up in early trade, but before long stocks began to drift lower. Fear of another sell-off perpetuated further selling, but stocks found stability upon reaching the flat line. From there the market was able to rebound, but the path higher was choppy.
Every single sector settled in positive territory, but tech stocks lagged for the entire session. They finished with a paltry gain of 0.1% and ultimately hampered the Nasdaq, which trailed its counterparts since the open. That said, Cisco (CSCO 18.61, +1.00) climbed to a new multi-month high with help from an upside earnings report.
Energy stocks were leaders for the better part of the day. The sector scored a near 2% gain with help from higher oil prices, which settled pit trade more than 2% higher, near $98 per barrel.
Data today had little lasting influence on sentiment. The latest weekly initial jobless claims count totaled 390,000, which is less than than 400,000 claims that had been exected, on average, among economists polled by Briefing.com. The latest tally is also 10,000 less than the prior week total.
The trade deficit contracted to $43.1 billion in September from $44.9 billion in the prior month. A $45.9 billion deficit had been widely expected for September.
As for the Treasury Budget. It had a deficit of $98.5 billion, which is less than the $105.0 billion deficit that had been expected to follow the $140.0 billion deficit from the prior month.
Advancing Sectors: Energy +1.8%, Health Care +1.4%, Industrials +1.1%, Materials +0.9%, Consumer Discretionary +0.9%, Telecom +0.9%, Consumer Staples +0.9%, Utilities +0.6%, Financials +0.6%, Tech +0.1%
Declining Sectors: (None)DJ30 +110.42 NASDAQ +1.96 NQ100 -0.1% R2K +0.7% SP400 +0.3% SP500 +9.62 NASDAQ Adv/Vol/Dec 1574/1.90 bln/940 NYSE Adv/Vol/Dec 2099/897 mln/912
3:30 pm : The rally in crude oil continued today after futures posted gains of 2.1% to close at $97.78 per barrel. Futures broke above the $98 mark to put in highs at $98.35, its best levels since Aug 1. Crude oil's recent rally was aided by easing worries over Italy. Better-than-expected econ data also helped prices today. Natural gas finished unchanged on the session at $3.65 per MMBtu. Futures sold off following this morning's inventory data, which showed a slightly larger-than-expected build, but managed to recoup those losses prior to closing... Gold ended lower by 1.8% at $1759.80 per ounce, while silver futures shed 0.7% to close at $34.11. Both metals sold off in morning trade, pressured by news that Greece finally named a new PM and the easing of Italian yields. Futures spent the remainder of the session attempting to recoup their losses. Gold ended in negative territory for the first time in four sessions.DJ30 +119.58 NASDAQ +5.72 SP500 +6.85 NASDAQ Adv/Vol/Dec 1562/1.5 bln/941 NYSE Adv/Vol/Dec 2123/653.9 mln/907
3:00 pm : Stocks continue to drift lower as they enter the final hour of trade. Tech continues to drag on action. The biggest sector by market weight is now down 0.1%.
Financials seem to be adding to the market's recent weakness. The sector now trades with a gain of only 0.3%, or about half of what the broad market has managed. DJ30 +93.21 NASDAQ -2.16 SP500 +7.83 NASDAQ Adv/Vol/Dec 1535/1.40 mln/950 NYSE Adv/Vol/Dec 2050/560 mln/910
2:30 pm : Stocks are drifting off of afternoon highs. The broad market pullback has pared the energy sector's gain to 1.5% after it had been up more than 2% earlier today. Despite that, energy remains one of the best performing groups in today's trade.
There isn't a single sector currently in negative territory, but tech stocks are up only 0.2%, which makes them the worst performers. Tech has been lagging all session. DJ30 +122.12 NASDAQ +4.12 SP500 +10.71 NASDAQ Adv/Vol/Dec 1570/1.29 bln/900 NYSE Adv/Vol/Dec 2060/510 mln/890
2:00 pm : Stocks have been unable to build on their recent bounce. Despite that, the broad market continues to boast a gain in excess of 1%.
The Nasdaq continues to trail its counterparts, trading with a gain that isn't even half what the Dow or S&P 500 have achieved. The Nasdaq has been hampered all session by the likes of Apple (AAPL 386.17, -9.11), eBay (EBAY 30.87, -0.31), and Google (GOOG 598.00, -2.87). DJ30 +160.34 NASDAQ +13.83 SP500 +14.90 NASDAQ Adv/Vol/Dec 1670/1.20 bln/805 NYSE Adv/Vol/Dec 2180/470 mln/760
1:30 pm : Stocks have benefited from a recent flurry of buying interest. The move coincides with a bounce by the euro, which is back near its session high with a gain of almost 0.8%.
Renewed strength among stocks has put added pressure on Treasuries. Lackluster auction results haven't helped prospects. Today's $16 billion auction of 30-year Bonds produced a yield of 3.20% and drew a bid-to-cover of 2.40 and an indirect bidder participation rate of 28.4%. For comparison, the past dozen auctions drew an average bid-to-cover ratio of 2.65 and an indirect bidder rate of 28.4%. DJ30 +169.31 NASDAQ +15.46 SP500 +15.78 NASDAQ Adv/Vol/Dec 1620/1.08 bln/815 NYSE Adv/Vol/Dec 2155/425 mln/765
1:00 pm : The major equity averages opened trade with impressive gains, but stocks quickly encountered pressure. The ensuing slide sent the Nasdaq into the red and the broad market to the neutral line before securing support.
As if a switch was flipped, sentiment appeared to improve overnight, helping the stock market open with gains on the order of 1% after it had tumbled more than 3% during the prior session for its worst single-session loss in about three months. Consistent with the trends of recent weeks, traders this morning tracked Europe's bourses. Italy held a successful auction of 12-month bills, implying that confidence isn't completely lost in in the country's ability to address its precarious fiscal and financial conditions.
Opening gains proved unsustainable, however. Tech, which is the largest sector by market weight, led the decline, although large-cap component Cisco (CSCO 18.82, +1.21) has displayed steady strength in the wake of its latest quarterly report. Weakness among tech stocks caused the Nasdaq to fall into negative territory before it was able to rebound.
Stocks were helped off of their lows by headlines that analysts at S&P have maintained a AAA rating on France's debt, and assigned a stable outlook to that rating, but the broad market has wavered in the wake of the knee-jerk buying.
Energy stocks have displayed steady strength, though. As a group, energy stocks are up more than 2%. Of course, that move has been helped by a jump in oil prices, which were last quoted at $98.10 per barrel for a 2.5% gain.
Although participants remain focused on the events of Europe, worth noting is that the latest initial jobless claims tally totaled 390,000, which is down 10,000 from the prior week and less than the Briefing.com consensus call for 400,000 initial claims. As for other data, the trade deficit for September eased down to $43.1 billion from $44.9 billion. That is less than the $45.9 billion deficit that had been broadly expected. DJ30 +128.48 NASDAQ +6.57 SP500 +11.47 NASDAQ Adv/Vol/Dec 1520/1.00 bln/895 NYSE Adv/Vol/Dec 1970/390 mln/940
12:30 pm : Like many stocks, energy issues had their early gains challenged, but the sector has since rebounded so that it now boasts a 1.3% gain. That makes Energy the best performing sector in the stock market.
Energy's rally has been helped by a jump in oil prices, which were last quoted at $97.85 per barrel for a 2.2% gain. With oil prices up so sharply, participants have been most attracted to oil and gas equipment, exploration, and services plays. As such, Halliburton (HAL 37.13, +0.70) and Baker Hughes (BHI 56.51, +0.74) are leaders in the sector. DJ30 +91.35 NASDAQ +2.15 SP500 +8.26 NASDAQ Adv/Vol/Dec 1605/895 mln/800 NYSE Adv/Vol/Dec 2160/350 mln/740
12:00 pm : Stocks staged a nice climb in recent trade. The move came at the same time that market participants learned that analysts at S&P have maintained a AAA rating on France's debt, and assigned a stable outlook to that rating.
The headline may have helped stocks extend their rebound from session lows, but momentum has started to slow. Despite that, the Dow is back to sporting a gain of more than 100 points. DJ30 +113.94 NASDAQ +7.64 SP500 +10.24 NASDAQ Adv/Vol/Dec 1540/795 mln/820 NYSE Adv/Vol/Dec 2100/310 mln/785
11:30 am : Stocks have rebounded from session lows, but remain well off of their opening levels.
Although tech had led the market's initial slide lower, financials have become a primary source of weakness. The sector had been up more than 1% this morning, but now it is down to a 0.2% loss. Every other sector is in positive territory.
Weakness among financials is largely owed to losses among investment banks and brokerages. Diversified financial services stocks are also succumbing to selling pressure, but overall bank stocks are looking decent, given the 0.5% gain currently boasted by the KBW Bank Index. DJ30 +66.15 NASDAQ -2.34 SP500 +4.90 NASDAQ Adv/Vol/Dec 1480/680 mln/870 NYSE Adv/Vol/Dec 1930/260 mln/915
11:00 am : Attempts by stocks to stabilize have been challenged by sellers, who have successfully sent the Nasdaq into negative territory, where it now trades with a decent-sized loss. Both the Dow and S&P 500 have managed to remain in positive territory.
The Nasdaq's relative weakness comes as shares of large-cap plays like Google (GOOG 594.95, -6.00) and Apple (AAPL 385.75, -9.53) falter. That said, Cisco (CSCO 18.70, +1.09) continues to sport a heady gain, thanks to a strong quarterly report. DJ30 +50.11 NASDAQ -9.23 SP500 +2.77 NASDAQ Adv/Vol/Dec 1220/500 mln/1080 NYSE Adv/Vol/Dec 1800/195 mln/1010
10:35 am : The dollar index hit a new session low at 77.40 around 9am EST, but has erased the majority of those losses and is back near 77.80. Overall, metals are trading notably lower and are the worst performing sector, while energy and agriculture are mixed. Gold, silver, copper and platinum are down ~2.1-3.2%.
Gold and silver have sold off in over the past hour and hit new session lows again in recent activity. Gold fell as far as $1740.80/oz about five minutes ago and is now down 2.8% at $1742.40/oz. Silver fell as low as $33.24 around the same time and is now down 3.1% at $33.31/oz.
Natural gas was trading about 0.8% lower at $3.75 ahead of inventory data. Following the data, which showed a build of 37 bcf versus the consensus that called for a build of 33 bcf, nat gas fell to a new session low of $3.71; now at $3.74, down 1 cent.
Crude oil has spent all morning in positive territory, but has been trending lower in recent activity. WTI crude oil futures are now up 0.8% at $96.50/barrel.DJ30 +31.56 NASDAQ -12.14 SP500 +0.91 NASDAQ Adv/Vol/Dec 1163/464 mln/1114 NYSE Adv/Vol/Dec 1554/185 mln/1214
10:00 am : Recent selling caused stocks to surrender some of their opening gains. The effort was most intense among tech stocks, which pulled back all the way to the flat line before stabilizing. That caused the tech-rich Nasdaq to slide before it was able to bounce off of the neutral line.
The recent slide by stocks coincides with a pullback by the euro, which is now up less than 0.4% against the greenback. The euro has been widely regarded as a barometer of sentiment in the eurozone. DJ30 +83.78 NASDAQ +0.48 SP500 +7.45 NASDAQ Adv/Vol/Dec 1775/120 mln/340 NYSE Adv/Vol/Dec 2410/65 mln/310
09:45 am : Stocks are sporting strong gains in the early going. Buying has been broad based with nine of the 10 major sectors up by 1% or more.
Although it is up a solid 0.8%, the tech sector is trailing the other major sectors and is slow to follow the lead of Cisco Systems (CSCO 18.78, +1.17), which is up sharply to a new multi-month high following its latest quarterly report. Still, the lack of strength in the rest of the tech sector has hampered the the Nasdaq, which currently trails its counterparts by a narrow margin. DJ30 +128.12 NASDAQ +19.86 SP500 +13.58 NASDAQ Adv/Vol/Dec NA/NA/NA NYSE Adv/Vol/Dec NA/NA/NA
09:15 am : S&P futures vs fair value: +16.30. Nasdaq futures vs fair value: +24.50. Stocks sold off in the prior session, but the sentiment switch has since turned to positive. The improved mood among market participants comes as traders track the action in Europe, where the region's major bourses have bounced to strong gains. The move there comes amid a successful debt offering by Italy, which has seen the yields on its debt ease lower to slightly less alarming levels. Headlines also suggest Greece has named Lucas Papademos to the position of prime minister. Buying interest in the euro has also picked up, giving it a 0.7% gain against the greenback after it dove about 2% in the prior session. So far the economic calendar has featured a modest decline in weekly initial jobless claims and a downturn in the monthly trade deficit. The Treasury Budget isn't due until 2:00 PM ET.
09:05 am : S&P futures vs fair value: +15.90. Nasdaq futures vs fair value: +23.50. Commodities are relatively mixed this morning, but the CRB Commodity Index is still up a solid 0.4%. Oil prices were quoted with a 1.6% gain at $97.25 per barrel in the opening minutes of pit trade. Natural gas prices are up a more tame 0.5% to $3.77 per MMBtu. Natural gas inventory numbers will be posted at 10:30 AM ET. Among precious metals, gold prices are down 1.1% to $1772 per ounce, while silver has shed 0.5% to trade at $34.20 per ounce.
08:35 am : S&P futures vs fair value: +15.90. Nasdaq futures vs fair value: +25.20. Stock futures continue to sport strong gains following the latest dose of data. Initial jobless claims for the week ended November 5 totaled 390,000, which is down 10,000 from the prior week and less than the Briefing.com consensus call for 400,000 initial claims. As for continuing claims, they totaled 3.62 million, down from 3.71 million.
Separately, the trade deficit for September totaled $43.1 billion, which is less than the $45.9 billion deficit that had been broadly expected. The prior month's deficit was revised downward to $44.9 billion.
October export prices, excluding agricultural items, fell by 1.5%, which marks a sharp reversal from the 0.3% increase reported for the prior month.
08:05 am : S&P futures vs fair value: +14.40. Nasdaq futures vs fair value: +24.00. Coming off of the stock market's worst single-session loss in about three months, participants are bidding stock futures higher. The risk on-risk off type of trade comes as participants continue to follow the lead of Europe's bourses, which have rebounded from a prior session sell-off to sport strong gains in the face of lingering concerns regarding fiscal and financial conditions in the region. Helping to quell some of those concerns, Italy held a successful auction of 12-month bills, albeit at a yield comfortably above 6.0%.
In the most recent round of earnings announcements, Cisco Systems (CSCO 17.61 -0.70, prior) posted an upside surprise that has its shares up more than 6% ahead of the open. Retailer Kohl's (KSS 54.29 -1.39, prior) also exceeded expectations for its bottom line, earning the stock a pre-market gain of almost 3%.
An improved mood among traders has resulted in a rotation out of Treasuries, taking the yield on the benchmark 10-year Note back above 2.0%. Results from an auction of 30-year Bonds will be posted at 1:00 PM ET.
As for the economic calendar, the latest weekly initial jobless claims count is due at the bottom of the hour, along with monthly trade numbers and trade prices. Also on tap for today is the Treasury Budget, which will be posted at 2:00 PM ET.
06:51 am : [BRIEFING.COM] S&P futures vs fair value: +9.70. Nasdaq futures vs fair value: +17.50.
06:51 am : Nikkei...8500.80...-254.60...-2.90%. Hang Seng...18963.99...-1050.50...-5.30%.
06:51 am : FTSE...5441.21...-19.20...-0.40%. DAX...5855.03...+25.50...+0.40%.
Special thanks to Bloomberg, CNNMoney and Yahoo! Finance for their market summaries. 
Best Regards,
M.A. Perry
Trader and Founder of
WRB Analysis (wide range body/bar analysis)
Price Action Trading (no technical indicators)

@
http://twitter.com/wrbtrader and http://stocktwits.com/wrbtrader Phone: +1.708.572.4885
Business Hours: 8am - 5pm est (Mon - Fri)
Skype Messenger: kebec2002
questions@thestrategylab.comGo Back To TheStrategyLab.com Homepage


