|
|
|
 |
|
|
| Trade History | Trade Strategies | Forum List | FAQs | Testimonials | Disclaimer |
Bullish Harami Reversal Pattern
Japanese Candlestick Pattern
The image to the left represents a generic image only and should only be used for definition purpose to differentiate this pattern from other generic Japanese Candlestick patterns.
Bullish Harami pattern should only be used as a confirmation signal to whatever primary trade methodology you are using.
In addition, this Japanese Candlestick pattern is very dynamic because it is suitable as a trend reversal signal and as a trend continuation signal.
However, it is not suitable as a counter-trend signal.
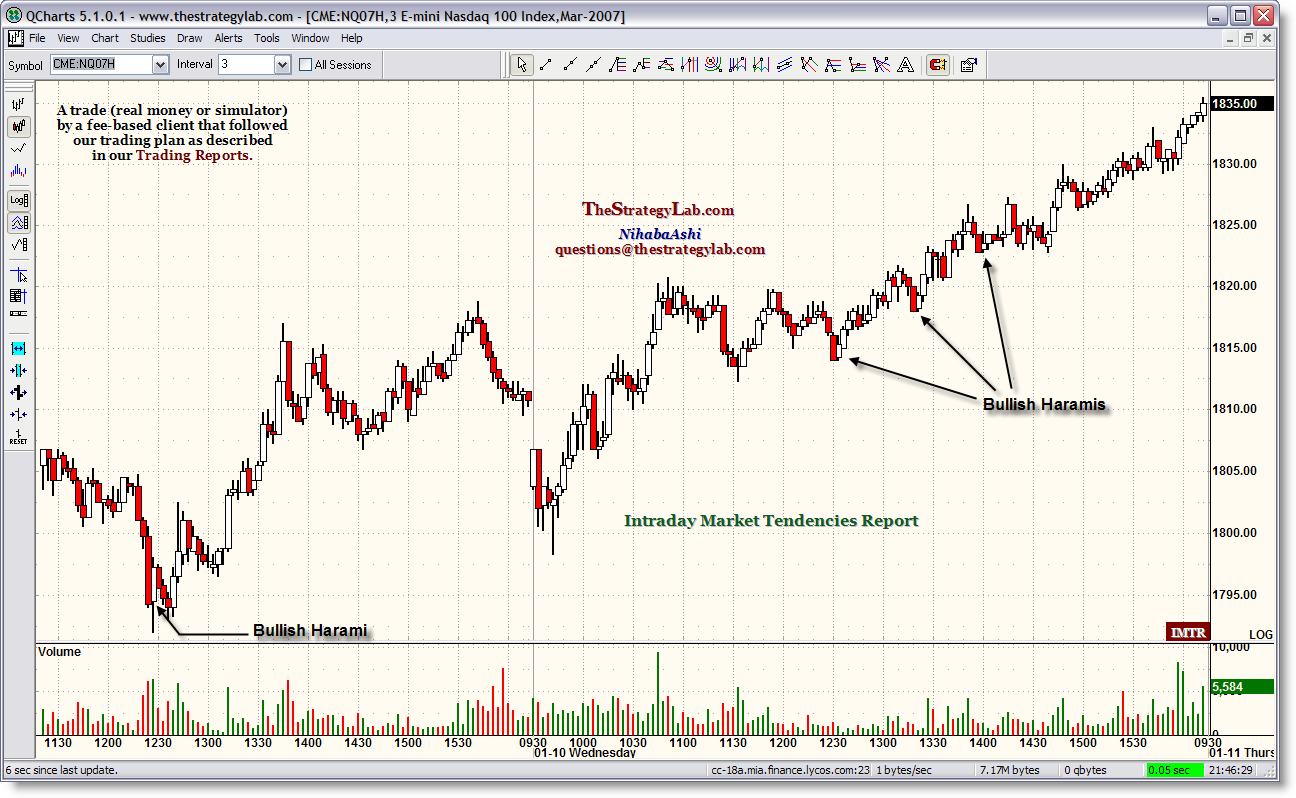
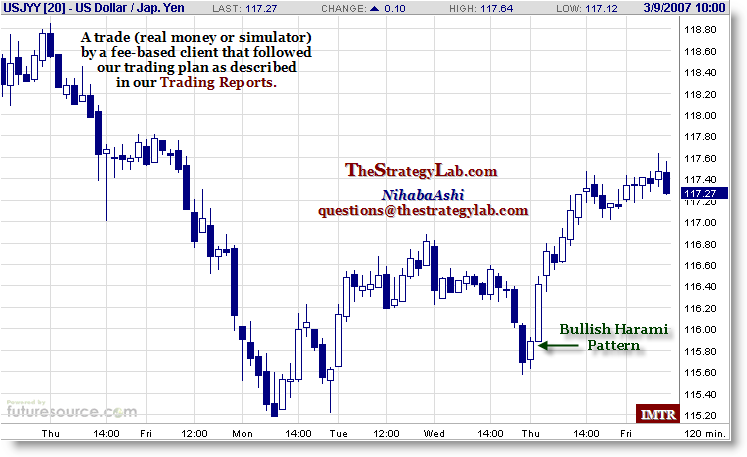
The chart below represents an image of an actual trade (real money or simulator) that was taken by one of our fee-based clients that has access to our primary trade methodology involving WRB Analysis while using the Bullish Harami pattern as a confirmation signal.
Click on image to view actual size
However, although the above charts shows one particular type of Bullish Harami, there are many different types (sub-groups) of Bullish Harami patterns that are defined via the recent price action that involves the Dark WRB, Small Body and S/R Zones.
The above charts do not show any trade management info because such info is only reserved for our fee-based clients.
With that said, the above generic info is for illustration purposes only.
Simply, the charts above do not teach you how to trade, they do not provide a complete trading plan and they will not act as a surrogate mother for not understanding the price action of the market your trading...represented by the below Basic Info (no trade management).
Yet, if your looking for info on understanding the price action, how to exploit that price action regardless to the candlestick pattern, a complete trading plan, realtime support along with profitable custom Japanese Candlestick patterns not discussed anywhere else outside of TheStrategyLab.com (discussed only with our fee-based clients)...its represented by the below Advance Info with Trade Management.
Basic Info (no trade management)
Advance Info with Trade Management
Popular Japanese Candlestick Books
Japanese Candlestick Charting Techniques
These strategies exploit repetitive price action that's explain in depth from entry to exit via 75 pages of profitable trading via Japanese Candlestick pattern recognition.
AJCTR is applicable for day trading, swing trading and position trading and is about 75 pages.
Discussion Forum
Regardless if you use the Bullish Harami as a strategy all by itself (not recommended) or as a confirmation signal (highly recommended)...
You must understand the price action prior to the appearance of the pattern signal to prevent the pattern signal from defining the price action resulting in poor trading performance.
Last of all, contact us, if you want to improve your understanding or trading of the Bullish Harami (what works and what does not work ) via the following trading instruments:
Best Regards,
M.A. Perry
Trader and Founder of WRB Analysis (wide range body analysis or wide range bar analysis)
Price Action Only Trading (no technical indicators)
@ http://twitter.com/wrbtrader/
http://www.thestrategylab.com
Phone: +1 708 572-4885
Business Hours: 8am - 5pm est (Mon - Fri)
Skype Messenger: kebec2002
questions@thestrategylab.com"Once a trend starts, the odds are that it will continue. Every student of science or engineering will recognize that this is nothing more than Newton's First Law of Motion, which says, Every body continues in a state of rest or of uniform motion in a straight line unless it is compelled to change that state by forces applied to it. Simply said, it is easier for a market to continue its direction than to reverse its direction." --Gregory L. Morris


Volatility Supply Demand Support Resistance Scalping Day Trading Swing Trading Position Trading GAP Trading
 "I
tested it on YM, Tbonds, FDAX, ER2. It's reliable on what I
trade and I will be purchasing your swing trading report soon." "I
tested it on YM, Tbonds, FDAX, ER2. It's reliable on what I
trade and I will be purchasing your swing trading report soon."
|
 "In
all fairness...I give credit to these results to Niha and what I have
learned from him." "In
all fairness...I give credit to these results to Niha and what I have
learned from him."
|
 "Your
material is exceptional, its REVOLUTIONARY, seriously." "Your
material is exceptional, its REVOLUTIONARY, seriously." |
||||
DAX FTSE100 CAC40 EuroFX EC HSI MHI NIFTY EMD TF ES NQ YM
Resources Used by TheStrategyLab.com
VXX QQQQ SPY IWM DIA CL QM Brent OIH XLE GC GLD ZN ZB ZF BUND EurUsd UsdCdn
TheStrategyLab.com
| Website Use Policies | Fee-Based Strategies | Performance Records | Affiliations and Sponsor | |
| Disclaimer | Applicable Trading Instruments | M.A. Perry Performance | Traders Library | |
| Privacy | WRB Analysis Tutorials (Premium) | Recent Trade History | Traders Invest-Store | |
| Anti-Spam Policy | Volatility Trading Report (VTR) | Trading Record Archives | Amazon | |
| Copyright Protection | Swing Trading Report (STR) | Systweak | ||
| Refund Policy | Advance Price Action Only Report (APAOR) | Traders Accounting | ||
| Referral Program | Advance Japanese Candlestick Trading Report (AJCTR) | Slysoft | ||
| Product Comparison | PayPal | |||
| Mentorship Program | ||||
| Discount Promotions | ||||
| Who We Are & Contact | Free Resources | Miscellaneous Resources | ||
| About Us | TSL Support Forum and Chat Room | Forum List | ||
| Twitter @wrbtrader | WRB Analysis Tutorials 30 Day Free Trial | Sitemap | ||
| Stocktwits @wrbtrader | #FuturesTrades Forum and Chat Room | |||
| delicious bookmarks | Blogs | |||
| Youtube Favorite Music | Twitters | |||
| TSL Support Forum Profile | Basic Japanese Candlestick Patterns | |||
| EliteTrader Profile | Trading Tips | |||
| Traderslaboratory Profile | Trader Consultation | |||
| Frequently Asked Questions | ||||
| Accolades (Testimonials) | ||||
| Contact | ||||
| Feedback | ||||
![]()
Copyright © 2002 - 2011. The Strategy Lab. All rights reserved.