 (click on image
to review trade performance results)
(click on image
to review trade performance results)
 https://www.thestrategylab.com/images/thestrategylab-review-102306-wrb-analysis.png
Archive
Chat Log @
https://www.thestrategylab.com/102306FuturesTrades.htm
Verification
of Price Action Trade Performance
@
https://www.thestrategylab.com/tsl/forum/viewforum.php?f=383
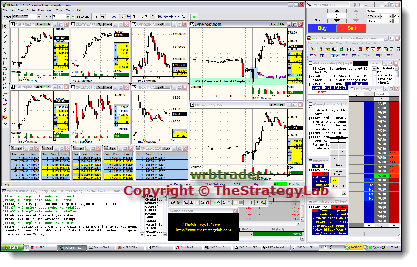
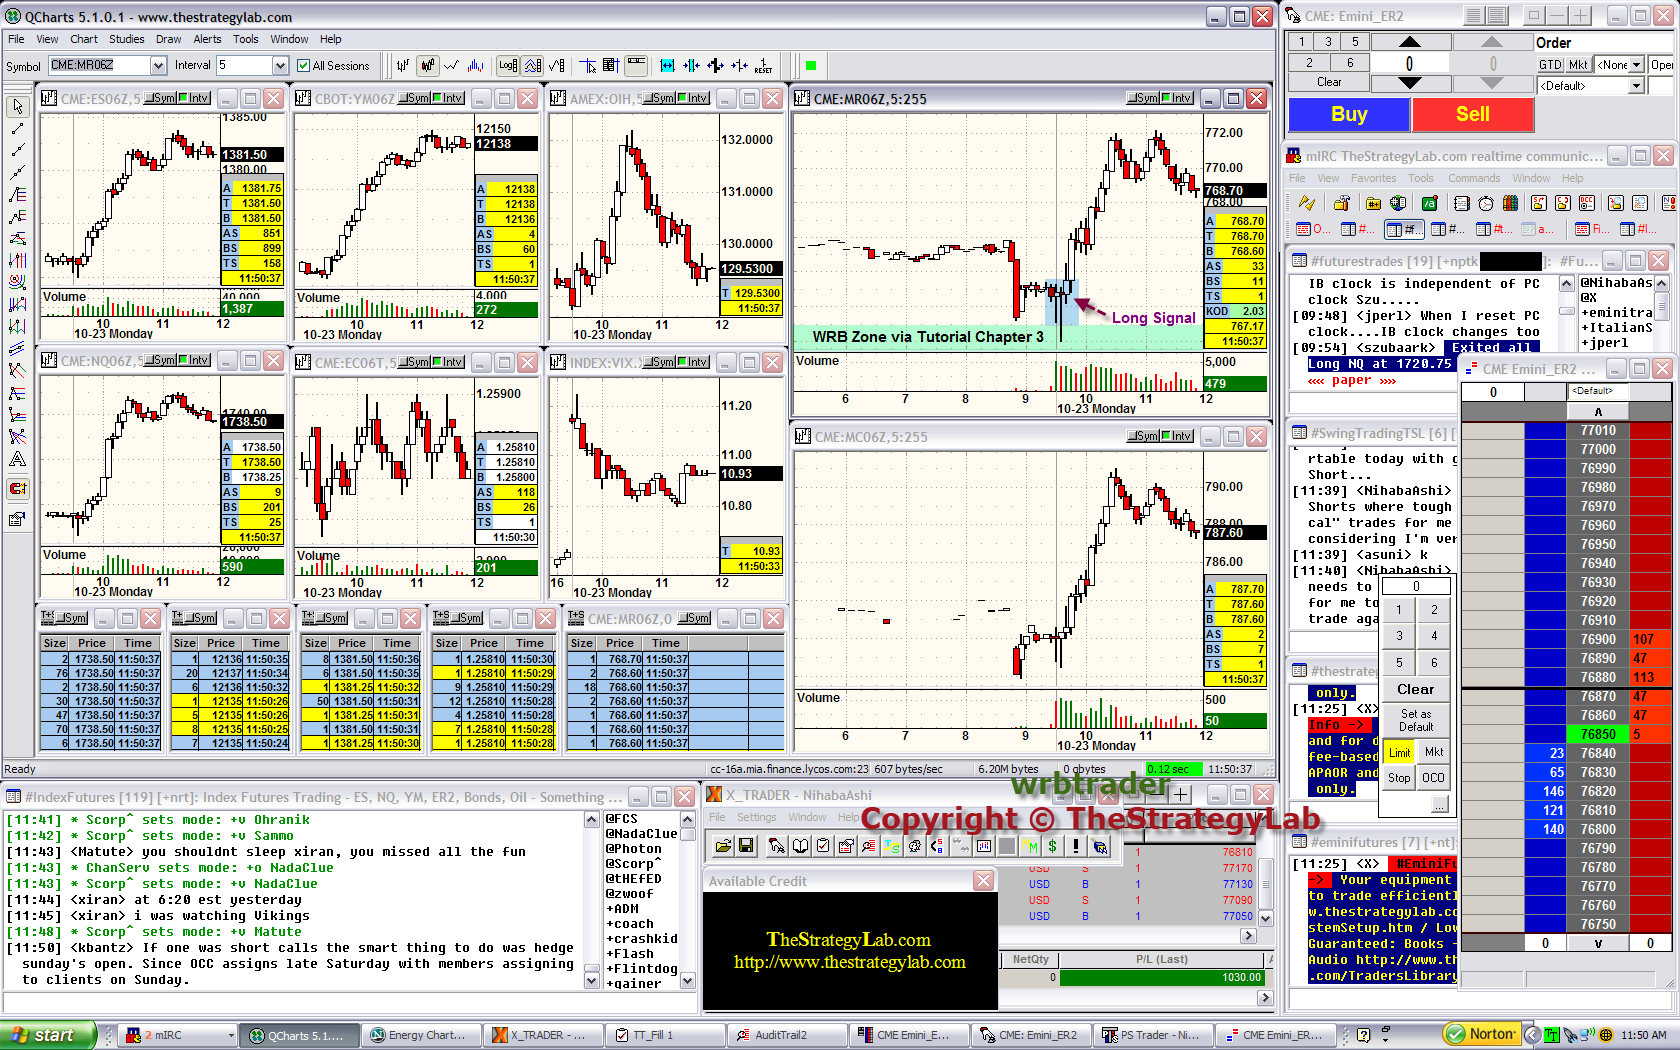
Image
on the left represents what many users in the
private chat rooms were able to see via live
screen sharing in real-time as the trades
occurred in the broker trade execution platform
and then the same trades are posted real-time
(average of 3.2 seconds delay via an
auto-script) in the free chat room.
I
took a quick screenshot during the live
screen sharing for marketing purposes within
minutes after my last trade of the day,
for my own private trade journal documentation
and for verification that I traded on that
specific trading day I posted real-time trades
in the free chat room for those that were not in the chat room or
not
allowed in the live screen sharing for
whatever reason with others that were allowed.
Further,
I use a multiple monitor setup while trading.
Other monitors not shown above, website or forum
for security & privacy reasons because they
contain the key markets for my volatility
analysis and correlation analysis.
WRB
Analysis Free Chat Room @ https://www.thestrategylab.com/ftchat/forum/
Recent
simulation trade performance via the CME Group
Trade Against A Pro Futures Challenge @
https://www.thestrategylab.com/tsl/forum/viewtopic.php?f=360&t=4038
Recent real money trade
performance @
https://www.thestrategylab.com/tsl/forum/viewforum.php?f=147
You can use WRB Analysis for day trading, swing
trading or position trading...it is a trading
course that is an introduction into
understanding the price action you're
trading...it does not teach
how to trade.
Price Action Trading Analysis, Price Action
Trading Strategies, Price Action Trading Chat
Room and Price Action Trading Forum @
TheStrategyLab
----------------------
 Introduction
 Foundation of WRB Analysis
@ WRB Analysis Free Study Guide
(word .doc & .PDF file)
Foundation of WRB Analysis
@ WRB Analysis Free Study Guide
(word .doc & .PDF file)
First
of all, there's a free study guide that
represents the first three basic WRB Analysis
Tutorial chapters for you to download, review
and apply to your trade
signal strategies or to help you design your
own trade signal strategies.
That's right...WRB Analysis is not
a trade signal strategy...its an
analysis of the price action so that
you will better understand the price action you're
trading along with improving the performance of
your own trade signal strategies when you use key
concepts from WRB Analysis.
There are a few older
versions (dated before 2015) on the internet
as such @ Forexfactory.com forum and other
trader forums that I'm not an active member of
those forums. The current version of the WRB Analysis Free Study
Guide is only available
directly from wrbtrader @ TheStrategyLab Support Forum
and it is dated January 2021 with more
specific information about what Key Market Events
(KMEs) and Correlation Analysis in tutorial
chapter 2.
For example, Key Market
Events (KMEs) that are important to
trading Emini Futures...those KMEs are not
important for someone trading the Canadian Dollar
and you must determine different KMEs that are
important to trading the Canadian Dollar. Just the
same, the
specific Key Market Events (KMEs) that
are important to trading Energy Futures...those
KMEs are not important for someone trading
the EuroFX Futures and you must determine different
KMEs that are important to trading the EuroFX
Futures.
Simply, you need
to find out which Key Market Events (KMEs)
are important to whatever you're trading and
TheStrategyLab can help you with such as you're
trying to determine how to use your trade signal
strategies with our price action analysis called WRB
Analysis.
 Reminder: If you do not know
which KMEs
are important to your trading instrument...our
price action analysis called WRB Analysis will be
useless to use with your trade signal strategies.
Reminder: If you do not know
which KMEs
are important to your trading instrument...our
price action analysis called WRB Analysis will be
useless to use with your trade signal strategies.
How do you
determine which KMEs are important in
understanding the price action of your trading
instrument ?
You need to open
your charts and begin documenting the dates and
time of big WRB Hidden GAP intervals. Next, you
need to research a site that has a good history of
key market events such as an economic calendar or
a news site that involves your specific trading
instrument...you then need to use tutorial chapter
2 of the WRB Analysis Free Study Guide
to determine if the WRB Hidden GAP interval has
qualified as a WRB Zone.
 (click
on image to review trade performance results)
(click
on image to review trade performance results)
https://www.thestrategylab.com/tsl/forum/download/file.php?mode=view&id=5682
Archive
Chat Log @
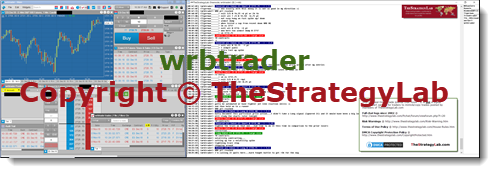
November 1st Thursday 2018
The above
verification image represents my middle monitor
(widescreen) of a three monitors
configuration...the image of my middle monitor is
then posted in my private trade journal that is
located in our private thread section of the free
TSL discussion forum.
As stated
earlier, not shown in my verification of
trading images are my other monitors that contains
charts involving KMEs, WRB Zones, Volatility
Analysis, Intramarket/Intermarket Analysis, and
Correlation Analysis for most of the trades shown
in my broker trade execution platform screenshots.
Next, you contact
us @ TheStrategyLab Support Forum
and begin posting DOKs to verify that you understand
the WRB Analysis Free Study Guide along with you
posting verification you're applying WRB
Analysis with your trade signal strategy via
redacted screenshots of timestamp trade fills in
your broker trade execution platform...the latter
verification information is only posted in your private
thread because we will use your timestamp of
trade fills in your broker trade execution
platform with your posted charts to verify your
application of key concepts from the WRB Analysis Free Study
Guide.
Also, the most
current version of January 2021 (not the 2014
version) for the WRB Analysis Free Study Guide
mentions the importance of inter-market
correlation analysis but the specific
details you'll need to ask TheStrategyLab
(wrbtrader) questions only in your private
thread because the specific details are only
shared with active members of the forum that have
posted their verification of learning/applying the
free study guide...DOKs and redacted screenshots
of timestamp trade fills in broker trade execution
platform that verifies the trader understands
& applying WRB Analysis Study Guide in their
trading.
- The January 2021 new
version of the WRB Analysis Free Study Guide
contains new corrections to typos, new charts,
redacted screenshots of timestamp trade fills in
broker trade execution platform, broker
statements, and other information not found in
the 2014 version.
Further, there's
information involving WRB Analysis that will never
be shared in any of the education resources. It's
Key KME WRB Zones that are different than the
normal KME WRB Zones in the WRB Analysis Free
Study Guide. Yet, if you consistently read the
free chat room chat logs since 2021...you will be
able to pick up tidbits about Key KME WRB
Zones that has dramatically improved my profit
targets and trade performance results since 2021
although I'm cautious that's its related to the
Covid Pandemic and increasing volatility.
Simply, we do not
share everything in the WRB Analysis Free Study Guide...the
best info involves current market conditions (not
market conditions from years ago) and is only
shared with those that have verified their
learning (understanding)/application of the WRB
Analysis Free Study Guide via your interaction
with wrbtrader at our forum in your private trade
journal.
- Also, this helps to
minimize the trolling by traders that do
not like the fact that I do not share key
information with them about WRB Analysis after
they refuse to post the required verification
information in their private thread @ TheStrategyLab Support
Forum
WRB
Analysis for TheStrategyLab involves what's known
as Wide Range Body
Analysis. Yet, if you're not interested in WRB Analysis and
you prefer to learn something very different
that's called Wide Range Bar
Analysis...there's another free website not
associated with TheStrategyLab that teaches Wide
Range Bar Analysis @ https://dotnettutorials.net/lesson/wrb-trading-strategy/
Dot Net
Tutorials
 Dotnettutorials.net (WRB
Trading Strategy) is a completely different trade
method involving using WRB intervals as a trade
signal strategy that is trying to identify a
smaller trend (price direction) within a larger
time frame.
Dotnettutorials.net (WRB
Trading Strategy) is a completely different trade
method involving using WRB intervals as a trade
signal strategy that is trying to identify a
smaller trend (price direction) within a larger
time frame.
As stated,
WRB Trade Strategy has no correlation to
TheStrategyLab and is often used in error by
traders interested in TheStrategyLab's WRB
Analysis.
In fact, the
creator of the WRB Trading Strategy method (Dot
Net Tutorials) is not a user of WRB
Analysis in which they make no reference
to our price action analysis of the WRB Analysis Free Study Guide
(e.g. KMEs, strong continuation / swing point
price actions, WRB Zones, contracting volatility,
volatility analysis, correlation analysis).
Once again,
WRB Analysis is just a price action analysis (not
a trade signal strategy) that works with your
trade signal strategies and it differs greatly
from Wide Range Bar Analysis (a WRB trade
signal strategy).
In contrast,
WRB Trade Strategy uses WRBs to determine trend
direction and using WRB intervals as a trade
signal strategy.
----------
Primary
Differences
WRB
Analysis (aka
Wide
Range
Body
Analysis) is only a price action analysis that
works with your trade signal strategy. In fact,
if you do not have a trade signal strategy...you
can not use WRB Analysis. In contrast, once
again, Wide Range Bar Analysis is
a trade signal strategy.
WRB Analysis
involves using candlestick charts whereas Wide
Range Bar Analysis involves using
bar charts and we've seen Wide Range Bar Analysis
associated with automated trading systems or
mechanical trading systems. In comparison, WRB
Analysis is a discretionary price action analysis
as you can see when you download / read the WRB Analysis Free Study
Guide.
WRB Analysis
(Wide Range Body
Analysis) involves Key Market Events (KMEs) as
explained in the WRB Analysis Free Study Guide.
Simply, WRB Analysis recognizes the importance of
the "first WRB Hidden GAP" interval that appears after
a key market event but only if it qualifies as
either a strong continuation price action or
swing point price action...resulting in as a WRB
Zone.
Also, WRB
Analysis puts emphasis on "contracting volatility"
intervals whereas Wide Range Bar
Analysis refers to these particular intervals as
"narrow range".
- KMEs,
first WRB Hidden GAP interval,
contracting volatility intervals and WRB Zones
are not concepts of Wide Range Bar
Analysis.
In fact, a
person online that does not mention the
above key concepts while talking about WRB
Analysis...its a person that's actually using Wide
Range Bar Analysis and/or does not
understand WRB Analysis.
Yet, if they
insist they're using WRB Analysis...they should be
able to show proof of their understanding via a
DOK as shown by users @ https://www.thestrategylab.com/tsl/forum/viewforum.php?f=61
along with getting a reply from me that their DOK
to verify their understanding of WRB Analysis is
correct or incorrect just like the user
did involving his understanding of WRB Analysis
via his DOK image as shown below.
 (click on image
to review DOK verification of understanding WRB
Analysis)
(click on image
to review DOK verification of understanding WRB
Analysis)
https://www.thestrategylab.com/tsl/forum/download/file.php?id=6090
Member
complete DOK verification @ https://www.thestrategylab.com/tsl/forum/viewtopic.php?f=61&t=4506
Many
DOK examples of understanding WRB Analysis @
https://www.thestrategylab.com/tsl/forum/viewtopic.php?f=61&t=719
In addition,
WRB Analysis users do not use volume. The
exception are Volume Spread Analysis (VSA) users
that use volume as part of their trade signal
strategy and they have merged WRB Analysis into
their trade signal strategy to improve the results
of its trade performance.
Thus, WRB
Analysis users only use volatility analysis (not
volume) to help with understanding the price
action they're trading.
Once again,
if the person insist that he/she do in fact
understand WRB Analysis...ask the person for
DOK charts that explains tutorial chapter 2
of the WRB Analysis Free Study Guide involving
both strong continuation price actions and swing
point price actions via the above key concepts.
Also, if the
person insist they're using WRB Analysis
(Wide Range Body Analysis) in their
trading (simulator or real money)...the
person should be able to easily post
verification of application via redacted
screenshots of timestamp trade fills in
broker trade execution platform to support any
positive / negative opinions about WRB Analysis to
go along with the charts that they used for
trading to explain their trades via WRB Analysis.
- Some of our WRB
Analysis users go a step further via showing
quantitative statistical analysis of their trade
signal strategy performance without WRB
Analysis versus the trade signal
performance with WRB Analysis embedded in their
trade strategy...posted in their private
thread because some users want privacy or
protection of their proprietary trade methods.
This type
of verification about any commentary by anyone
using WRB Analysis is important because
the verification requirements is requested in our
education resources here @ TheStrategyLab.
Further, it helps to ensure they're not a
clueless troll that's confused about the
differences between WRB Analysis and Wide
Range Bar Analysis.
In
fact, the more verification info that's posted
by a user of WRB Analysis in his/her private
thread...the more I share about WRB
Analysis.
----------
With that
said, one of the biggest problems with retail
traders (that's you) is that trading is performed
first via the perspective of the trade signal before the analysis
or there's very little understanding of
the analysis. Further, more often than not for
retail traders, the documentation & journaling
of the analysis is poor from the beginning and
then continuing to be poor into the documentation
& journaling of the trading (simulator or real
money).
In contrast,
to succeed in trading...we need to understand the
price action (the analysis) prior
to any trading (simulator or real money) must be
ongoing with the documentation & journaling.
This process will help minimize trade losses and
make you a more consistent / profitable trader as
you design your trade signal strategies or fix
problems with your current trade signal
strategies.
Thus, the
minimum requirement to get traveling
along the road of consistent profits is to first
backtest your trade signal strategy and then
properly document & journal your
design/analysis/simulator trading prior
to any real money trading. By the way, you can
still manually backtest your trade signal strategy
if you do not know anything about programming
& coding. You just need access to historical
data/charts for the manual backtesting. If you can
not do the minimum requirement prior
to real money trading...you're just a lazy trader
that will most likely join the list of failed
traders
 Analysis
---> Trade Signal
Strategy ---> Backtest
Trade Signal Strategy ---> Simulator Trading
(documenting & journaling) ---> Real Money
Trading (documenting & journaling)
Analysis
---> Trade Signal
Strategy ---> Backtest
Trade Signal Strategy ---> Simulator Trading
(documenting & journaling) ---> Real Money
Trading (documenting & journaling)
I know what you're thinking.
Yep, its a lot of work and nobody told you
that you will need to do the above to succeed
as a profitable trader but you gotta
do the work or else you will just
become another failed trader. You can get
started via starting your private trade
journal at TheStrategyLab.
Members
Private Trade Journals & Private Threads
@
https://www.thestrategylab.com/tsl/forum/viewforum.php?f=117
With that said, M.A. Perry (that's me) begin
developing this type of price action analysis of
the markets in the early 1980's and begin trading
one strategy derived from WRB Analysis in the late
1980's. I then begin documenting WRB Analysis
online via the user name NihabaAshi (user name
derived from martial arts and Japanese
Candlesticks Analysis). Today, I
use the online user name wrbtrader and I
now use several different trade signal strategies
embedded with key concepts from WRB Analysis to
exploit different types of market conditions due
to the fact that market conditions are never the
same from one trading day to the next trading day
as in one size does not fit all.
Thus, I
concentrated on understanding the price action
(trends, range, chop et cetera) via WRB Analysis
for many years prior to
developing my first trade signal strategy with
rules from entry to exit...prior
to my very first trade. Further, in the 1980's
when I first started studying the markets (no
trading at this time for many years) because I was
a teenager...I came upon the price action of a WRB
accidentally when a hand drawn chart I was
preparing for a relative, that was a floor trader
at the time, when I realized upon completing the
hand drawn chart that I was missing one interval.
That missing interval was a Wide Range Bar
(expansion bar) in comparison to prior intervals.
In my review, I noticed how that missing interval
had impact on a few swing points, reaction points
and profit targets later in the hand drawn chart.
I immediately began studying other charts of
different markets and started seeing other similar
like price actions to prompt my initial curiosity
into what I would later call WRB Analysis. Yet, I
initially called them Wide Range Bar Analysis
until I had access to candlestick charting
software in the early 90's. Thus, I traverse from
bar charts to candlestick charts and my definition
of the word WRB involved both candlestick charts
and bar charts. However, I developed a preference
of Wide Range Body Analysis (candlestick
charts) because I was able to quickly "visualize"
the developing price action on candlestick charts
in comparison to using bar charts especially when
I became more of a price action only trader that
doesn't use computer codes nor automation trading
to exploit changes in supply/demand via changes in
volatility.
What exactly is
WRB Analysis?
WRB Analysis is a method that involves the
combination of analyzing changes in volatility and
supply/demand. Simply, WRB helps traders to
understand and exploit changes in volatility as a
way to identify key price areas where there's an
important change in supply/demand prior to the
appearance of any trade signals.
WRB
Analysis can be applied to time based
candlestick or bar charts, volume based charts
or tick based charts although the chart examples
at this website are via time
based candlestick charts.
Also, WRB
Analysis identifies changes in supply/demand
that's occurring between buyers and sellers along
with providing a map for exploiting the price
action from swing point to swing point regardless
if your a day trader, swing trader or position
trader.
The word WRB
means Wide Range Body
(candlestick chart users) or Wide Range
Bar (bar chart users)
and there are different types of WRBs based upon
volatility analysis, gap analysis or
support/resistance analysis. Yet, be aware that
you can use Bar charts for WRB Analysis but you
must be using Wide
Range Body Analysis
and not Wide Range Bar Analysis.
The wide range is
an interval that has a body (difference
between Open and Close) or bar (difference between
high and low) with a price area larger than each
of the prior three intervals. In fact,
you can use any number greater than three
intervals as long as it's not less than three due
to the behavior of volatility analysis because its
less reliable and too difficult to analyze the
volatility of two intervals or less regardless if
the intervals are based upon time, volume or tick.
Simply, you want as much market context as
possible from the price action to help ensure
proper analysis of changes in volatility and
supply/demand.
Yet, there will
often be a different number of WRBs, WRB Hidden
Gaps and WRB Zones depending upon what aspect of
the expansion interval is being used as a
measurement. However, even
though you may see the word body used
more often than the word bar in my
discussions of WRB Analysis at
TheStrategyLab.com or charts posted elsewhere
online, it does not imply that candlestick
charts should be used instead of bar charts
its
only because I have a personal preference in
using candlestick charts even though WRB
Analysis has nothing to do with Japanese
Candlestick Analysis.
In
fact, about 25% of our clients use bar
charts instead of candlestick charts while using
WRB Analysis in their trading.
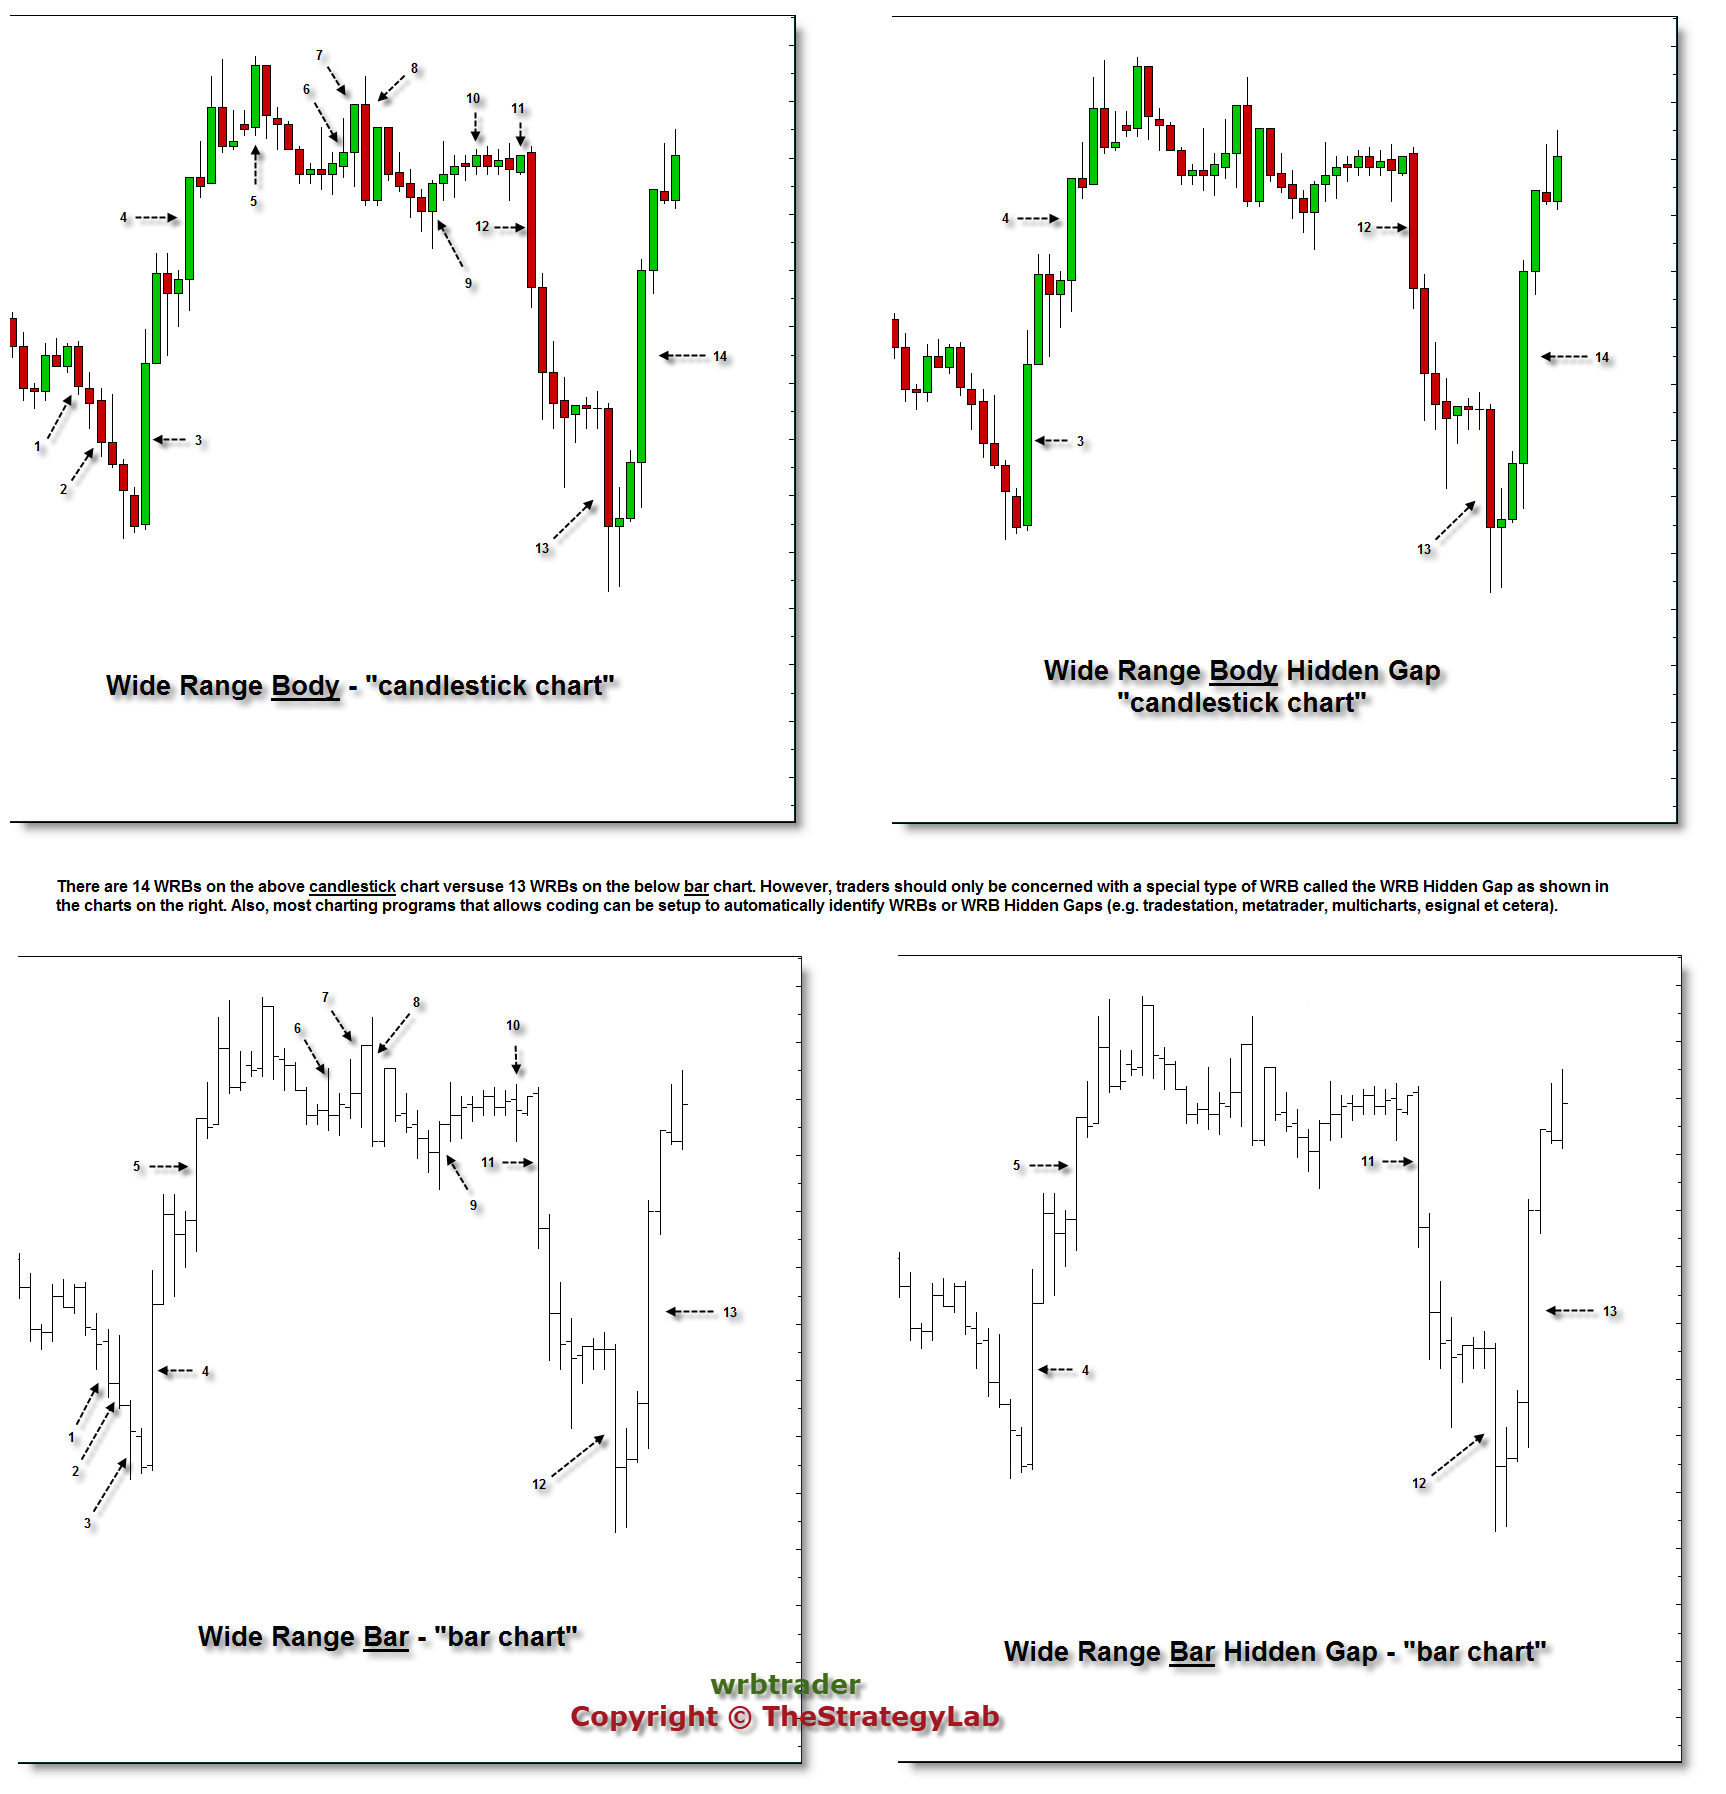
Charts of WRB
(wide range bodies) and (wide range bars)
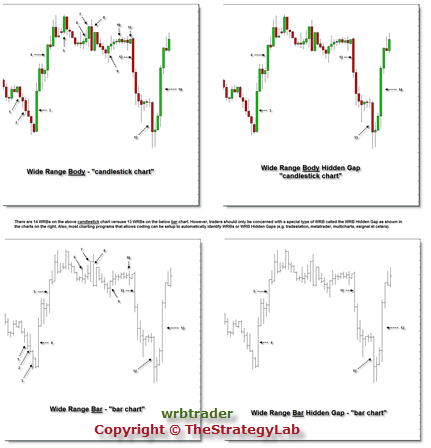
(click on chart to review WRB Analysis
Differences)
 https://www.thestrategylab.com/images/wrb-analysis-candlestick-chart-versus-bar-chart.png
We ask for you to
take a closer look and review the chart examples
on the left to see the technical difference when
comparing a candlestick chart to a bar chart via
WRB Analysis. Charts on the left in the image
represents all WRBs whereas charts on the
right in the image represents the important WRBs
called WRB Hidden Gaps.
It's the WRB
Hidden Gaps that traders should be
monitoring because they represent key changes in
supply/demand and volatility. Simply, not all WRBs
are important and the few that are important must
be identified to be able to identify where key
market participants are most likely to get
involved in the price action.
Also, most
charting programs that allows coding can be setup
to automatically identify WRBs or WRB Hidden Gaps
(e.g. tradestation, metatrader, multicharts,
esignal et cetera).
WRB Analysis in
combo with your Strategy
WRB Analysis are not trade signals by itself.
Instead, it must be merged with your trade signals
or used to confirm a trade signal is valid for
trading. Thus, WRB Analysis is an understanding
of the price action and that in itself
makes it much more important than just trade
signals.
WRB Analysis can
be used just to get a better understanding of what
really is leading your trading instrument for a
particular trading day, used only as profit
targets for those that have trouble staying with
their winners, used to improve the trade
management (after entry) of many different types
of methods or trading styles (day trader, swing
trader or position trader).
Therefore, the purpose of WRB
Analysis is to be integrated
into your own methods to enhance their
performance of any of the
following strategies you may be using as your
trade methodology:
Breakout
Strategy
Fading
Breakout
Strategy
Divergence
Strategy
Support/Resistance
Strategy
Confluence
Strategy
Double
Bottom/Double Top Strategy
GAP Strategy
(Regular Session Gaps and Globex All Session Gaps)
Trend Strategy
Range Strategy
Profit Target
Strategy
Volume
Spread Analysis (TheStrategyLab.com has a
few clients using VSA even though we ourselves do
not use this methodology)
Intermarket
Analysis
Market Seasonal
Tendencies (Cycles) Analysis
Volatility
Analysis and it replaces the need for volume
analysis
Japanese
Candlestick Patterns (time and volume based
candlestick charts)
Traditional Chart
Patterns (ex. triangles, wedges, head and
shoulders, flags, pennants and rectangle price
action)
Technical
Indicators (ex. rsi, cci, macd, stochastics,
moving averages, average true range, obv and many
others)
Trading
Instruments suitable for WRB Analysis
Tutorials
The nature of WRB Analysis
Tutorials makes it suitable for any of the following trading
instruments.
Futures
Forex Currencies
Stocks
Exchange Traded Funds
WRB Analysis
Tutorial Chapters 1, 2 and 3 Free Study Guide
You
can download the free study guide @
https://www.thestrategylab.com/tsl/forum/viewtopic.php?f=5&t=180
However,
if you are not using any of the above trade
methodologies and want to find out more
information about our trade strategies that has
WRB Analysis integrated into the strategies...click
here.
Last of all, if you have any
trading related questions...please do not hesitate
to contact us because we've helped hundreds of
traders regardless if they use our methods or
their own trade methods.


 @
@


